
GEOPHIRES Case Study: 500 MW EGS Modeled on Fervo Cape Station (October 2026 Update)¶
Introduction¶
The GEOPHIRES example Fervo_Project_Cape-7 is a case study[1] of a 500 MWe EGS project modeled on
a second-of-a-kind (SOAK) analog of Phases I and II of Fervo Energy’s Cape Station project.
Key results include LCOE = $109.2/MWh, IRR = 21.5%, and Total CAPEX = $7100/kW. Click here to go to the Results section.
The October 2026 Update aligns the case study’s subsurface design with the Fervo 3.0 well design disclosed for Cape Station Phase II, models lateral drilling, grid interconnection, and transmission service costs explicitly, and updates PPA pricing to Fervo’s reported range for contracts under negotiation (Fervo Energy, 2026f). See the Previous Versions section for a summary of changes from the February 2026 Update.
Click here to interactively explore the case study example in the GEOPHIRES web interface.
Modeling Overview: A Consensus-Based Second-of-a-Kind Analog¶
This case study models a 500 MWe Enhanced Geothermal System (EGS) project designed to represent a Second-of-a-Kind ( SOAK) deployment. Rather than serving as an exact facsimile of Cape Station as built, this study estimates what a non-Fervo developer could achieve on a geologically analogous site, relying primarily on publicly available data and standardized engineering estimates. The model assumes the developer is a “fast follower”: benefiting from the proof-of-concept established by Cape Station Phase I, whose first GeoBlock reached first power and commercial operation in September 2026 (Fervo Energy, 2026e; 2026j), but operating without access to Fervo’s private supply chain or proprietary optimization data.
Public Data Reliance: Inputs utilize publicly available data for parameter values where applicable, such as geothermal gradient and reservoir density. Where data is proprietary or otherwise unknown, values are inferred from public announcements or extrapolated from standard industry correlations.
Conservative Constraints: To ensure the model serves as a robust feasibility test, some inputs are intentionally conservative compared to Fervo’s stated targets, such as drilling costs, parasitic load, and water loss.
Commercial Viability Threshold: Implicit in this design is a screening for investment-grade returns. Where public data provided a range of potential values rather than a precise figure, inputs were selected from within those bounds; the case study does not tune inputs to a target return. The PPA price is a market input: the starting price of $115/MWh is the midpoint of the $100–130/MWh range Fervo reports for contracts under negotiation (Fervo Energy, 2026f), which yields a levelized PPA price of $125.1/MWh (nominal) with the modeled escalation. The resulting after-tax IRR of 21.5% is read as evidence that a Second-of-a-Kind deployment can clear the premium over remaining technology risk that a developer would require. The finding is contingent on current clean firm power pricing rather than on cost assumptions alone: with the February 2026 Update’s PPA terms ($95/MWh starting price, $0.57/MWh annual escalation, no cap) and all other inputs unchanged, the after-tax IRR is 13.4% and the NPV is -$71M. An illustrative example of selection within a range is Fracture Height, which was set to yield an effective fracture surface area consistent with the ResFrac simulation results in Singh et al. (2025).
Fast Follower Advantage: By entering the market after Fervo’s initial de-risking campaigns, the modeled developer avoids the high tuition costs of early experimentation. Fervo’s drilling costs at Cape Station fell from $9.4M to $4.8M per well over its Phase I learning curve, for wells with 5,000 ft laterals at roughly 400℉. Against the 2025 NREL drilling cost curve with the lateral costed explicitly (Akindipe and Witter, 2025), those two points correspond to drilling cost adjustment factors of 1.14 and 0.58. This model uses a factor of 0.72, the geometric mean of the ATB-aligned baseline (0.9) and Fervo’s best demonstrated well (0.58), applied to the larger 3.0 design well (3.06 km, 7,500 ft cased lateral, 430℉) that a developer building today would drill. The resulting $8.48M/well is therefore not comparable to Fervo’s Phase I figures on a per-well basis; on a like-for-like basis, it sits between Fervo’s demonstrated performance and the unadjusted industry baseline. This reflects a developer who capitalizes on established industry knowledge to skip the First-of-a-Kind (FOAK) premiums but has not yet achieved the fully optimized learning rates of a mature Nth-of-a-Kind (NOAK) operator. Note that the February 2026 Update, at $4.65M per well, corresponded to an effective factor of about 0.58 once the lateral is accounted for, i.e. Fervo’s best demonstrated well rather than a SOAK assumption.
Intended Use Cases¶
This case study is designed to function as a public utility for the geothermal sector, serving two primary roles:
Industry Benchmark: By relying primarily on verifiable public data and independent expert consensus, this model establishes a transparent baseline for EGS viability. It tests the premise that Fervo’s success at Cape Station is a replicable standard for the next-generation geothermal industry. The results serve as reference points for what is achievable using current technology in high-grade resources.
Template for Resource Assessment & Custom Modeling: The example input file (Fervo_Project_Cape-7.txt) is intended as customizable template for modeling other resources. Users can input local geologic data (gradient, rock properties) into this template to evaluate how a Cape Station-style design would perform in different geographies (e.g., Nevada vs. Utah vs. International). Different plant sizes and performance targets can be modeled by adjusting the number of production wells, fractures per well, and other technical & engineering parameters. The model allows users to stress-test economic assumptions, such as the PPA price or Investment Tax Credit (ITC), to see how policy changes impact the feasibility of replicating this design elsewhere.
Disclaimer: Independent Analysis¶
This case study is an independent techno-economic analysis developed by the author and contributors to the GEOPHIRES open-source project. It is not affiliated with, sponsored by, or endorsed by Fervo Energy. The author and contributors are not employees or agents of Fervo Energy, and this work has not been reviewed or approved by the company. All modeling assumptions, including those derived from public data sources, represent the independent interpretation of the author and the GEOPHIRES open-source community and do not constitute proprietary information or official company projections.
Furthermore, as noted in the Discussion section, this analysis provides a validated economic baseline rather than a fully burdened commercial pro-forma. Actual financial results may vary based on project-specific overhead, financing fees, and operational complexities not explicitly itemized in this study.
Methodology¶
The Inputs and Results tables document key assumptions, inputs, and a comparison of results with reference values. Note that these are not the exhaustive sets of inputs and results, which are available in source code and the web interface.
See the Calibration with Fervo-implemented Field Design section for a detailed explanation of how key case study reservoir engineering input parameters were derived.
Inputs¶
See Fervo_Project_Cape-7.txt in source code for the full set of inputs. Refer to the GEOPHIRES Parameters reference for descriptions and specifications of all available GEOPHIRES input parameters.
Reservoir Parameters¶
Parameter |
Input Value |
Comment |
|---|---|---|
Surface Temperature |
13 ℃ |
Surface temperature near Milford, UT (38.4987670, -112.9163432) (Project InnerSpace, 2025). |
Number of Segments |
3 |
|
Gradient 1 |
74 ℃/km |
Sedimentary overburden. 200℃ at 8500 ft depth (Fercho et al. 2024); 228.89℃ at 9824 ft (Norbeck et al. 2024). |
Thickness 1 |
2.5 km |
|
Gradient 2 |
41 ℃/km |
Crystalline reservoir |
Thickness 2 |
0.5 km |
|
Gradient 3 |
39.1 ℃/km |
Sugarloaf appraisal |
Reservoir Depth |
3.06 km |
Depth at which the segmented gradient yields a bottom-hole temperature of approximately 221℃ (430℉), the average reservoir temperature design point of the Fervo 3.0 well design used for Cape Station Phase II (Fervo Energy, 2026f; 2026g). The previous value of 2.68 km was extrapolated from surface temperature, gradient, and average production temperature of shallower and deeper producers in Singh et al., 2025, corresponding to the roughly 400℉ Phase I design. Fervo reports 460℉ at the Sawtooth 7 well (Fervo Energy, 2026a), so 430℉ is not an upper bound for the resource. |
Reservoir Density |
2800 kg/m³ |
phyllite + quartzite + diorite + granodiorite (Norbeck et al., 2023) |
Reservoir Heat Capacity |
790 J/kg/K |
|
Reservoir Thermal Conductivity |
3.05 W/m/K |
|
Reservoir Model |
Multiple Parallel Fractures (Gringarten) |
See the reservoir engineering calibration section for additional details. |
Number of Fractures per Stimulated Well |
225 |
The model assumes an Extreme Limited Entry stimulation design (Fervo Energy, 2023a) utilizing 15 clusters per stage (derived from Singh et al., 2025) and 81–85% stimulation success rate per 2024b ATB Moderate Scenario (NREL, 2025). The previous 12-stage count for a 5,000 ft lateral is scaled proportionally to 18 stages for the 7,500 ft lateral of the Fervo 3.0 design, preserving the stage length of approximately 417 ft. Fervo attributes more stimulated reservoir volume per well and a more gradual decline profile to the longer laterals (Fervo Energy, 2026f). |
Fracture Separation |
9.8255 m |
Based on 30 foot cluster spacing (Singh et al., 2025) marginally uprated to align with long-term thermal decline behavior trend towards wider fracture spacing (Fercho et al., 2025). |
Fracture Shape |
Rectangular |
Bench design and fracture geometry in Singh et al., 2025 are given in rectangular dimensions. |
Fracture Width |
305 m |
Matches intra-bench well spacing of 500 ft (corresponding to fracture length of 1000 ft) (Singh. et al., 2025) |
Fracture Height |
100 m |
Actual fracture geometry is irregular and heterogeneous; this height complies with the minimum height required by the implemented bench design (200 ft; 60.96 meters) and yields an effective fracture surface area consistent with simulation results in Singh. et al., 2025. |
Water Loss Fraction |
1% |
Fervo states that “long-term modeling, calibrated to early field data, predicts high circulation recapture rates” and that previous studies have shown recapture rates of 80% to 99% (Geothermal Mythbusting: Water Use and Impacts; Fervo Energy, 2025a). The 1% loss fraction corresponds to the top of that range. Modeling in Singh et al., 2025 predicts fluid loss of 0.36% to 0.49%. |
Well Bores Parameters¶
Parameter |
Input Value |
Comment |
|---|---|---|
Multilaterals Cased |
True |
Fervo’s laterals are cased and cemented for plug-and-perf multistage stimulation (Norbeck et al., 2024). GEOPHIRES halves the lateral cost when this is False (the default), on the assumption that casing and cementing are 50% of drilling cost. |
Number of Production Wells |
50 |
Number of production wells required to produce net generation greater than the PPA minimum and total generation less than nameplate capacity (11 × 60 MWe Gen 2 ORCs = 660 MWe gross; the February 2026 Update assumed 10 units, which cannot deliver 500 MWe net at a parasitic load of 20% or more). Reduced from 56 in the February 2026 Update; Fervo reports approximately 27% more power output for the same amount of steel at 430℉ versus 400℉ (Fervo Energy, 2026f), partly offset by the higher parasitic load now modeled (see Injectivity Index). 49 producers also satisfies the PPA minimum (500.2 MWe) but with lower NPV; 50 provides an 11 MWe margin. The resulting 84 initial wells (50 producers, 34 injectors) for 500 MWe, about 0.17 wells per MWe, is fewer wells per MWe than the up to 80 wells (0.20 per MWe) Fervo anticipates for the 400 MWe Phase II program (Fervo Energy, 2026f). The resulting average of ~12.6 MW gross (~10.5 MWe net) per production well is below the 15 MW gross power per production well Fervo shows for the 3.0 design (Fervo Energy, 2026g), which appears to require flow rates above the 107 kg/s modeled here (see Production Flow Rate per Well). |
Number of Injection Wells per Production Well |
0.666 |
Modeled on the reference case 5-well bench pattern (3 producers : 2 injectors) described in Singh et al., 2025. |
Nonvertical Length per Multilateral Section |
7500 feet |
Lateral length of the Fervo 3.0 well design used for Cape Station Phase II (Fervo Energy, 2026f; 2026g); Phase I used 5,000 ft laterals, the target length given in the environmental assessment (BLM, 2024). Note that lateral length is assumed to be an upper bound constraining the number of fractures per well for a given cluster spacing. |
Well Geometry Configuration |
L |
L configuration: vertical section to reservoir depth plus one lateral per well. Required for GEOPHIRES to cost the lateral explicitly. |
Number of Multilateral Sections per Vertical Section |
1 |
One lateral per well (producers and injectors); GEOPHIRES multiplies by the total well count, so this does not need updating when the number of wells changes. The February 2026 Update set Number of Multilateral Sections to 0 and folded lateral cost into the vertical well cost via the adjustment factor; the lateral is now costed explicitly (see All-in Nonvertical Drilling Costs and Multilaterals Cased). Requires GEOPHIRES 3.16.1 or later. |
Production Flow Rate per Well |
107 kg/sec |
Cape Station pilot testing reported a sustained flow rate of 95–100 kg/s and maximum flow rate of 107 kg/s (Fervo Energy, 2024). Modeling by Singh et al. suggests initial flow rates of 120–130 kg/sec that gradually decrease over time (Singh et al., 2025). The case study flow rate is chosen both as a conservative target for long-term sustainability and to achieve a more economically favorable drawdown and redrilling schedule. Pumping load is set by the Productivity and Injectivity Index parameters rather than by flow rate; see Injectivity Index. |
Production Well Diameter |
7.825 in |
Inner diameter of 8⅝ inch, 36 lb/ft casing. Fervo disclosed 8⅝ inch casing for the 3.0 well design (up from 7 inch in Phase I) (Fervo Energy, 2026f; 2026g); the February 2026 Update inferred 9⅝ inch (8.535 in ID) from a less specific announcement (Fervo Energy, 2025b). Casing weight is not disclosed; API IDs for 8⅝ in range from about 7.5 in (49 lb/ft) to 8.1 in (24 lb/ft). |
Injection Well Diameter |
7.825 in |
See Production Well Diameter |
Production Wellhead Pressure |
303 psi |
Modeled at a constant 300 psi in Singh et al., 2025. We use a marginally uprated value to conform to GEOPHIRES’s calculated minimum wellhead pressure and nominally align with the gradual increase in WHP for constant flow rates modeled by Singh et al. |
Injectivity Index |
1.20 kg/sec/bar |
Based on ATB Conservative Scenario (NREL, 2025) derated per analyses that suggest lower productivity/injectivitity (Xing et al., 2025; Yearsley and Kombrink, 2024), and further derated in this version (from 1.38) to yield a parasitic load of at least 20% of net generation. Norbeck (2026) reported observed parasitic loads of approximately 25–35% in Phase I operations with a goal of eventually reaching 15–20%; a SOAK case is not credibly modeled below the low end of that goal. The February 2026 Update’s ~16% aligned with the 16.7% ceiling implied by Fervo’s Phase II procurement of 480 MW gross for 400 MW net, which is a design target rather than observed performance. Result: 21.1% initial and 20.8% average pumping power relative to net generation (17.2% relative to gross generation). The production-side pressure drop is dominated by flow ÷ Productivity Index; the injection side becomes pump-limited once flow ÷ Injectivity Index exceeds the plant outlet pressure, which occurs below an Injectivity Index of roughly 1.38 at 107 kg/s per producer. |
Productivity Index |
0.98 kg/sec/bar |
See Injectivity Index. Derated from 1.13 in proportion with the Injectivity Index (ratio 1.22 preserved). |
Ramey Production Wellbore Model |
True |
Ramey’s model estimates the geofluid temperature drop in production wells |
Injection Temperature |
53.6 ℃ |
Calibrated with GEOPHIRES model-calculated reinjection temperature (Beckers and McCabe, 2019). Close to upper bound of Project Red injection temperatures (75–125℉; 23.89–51.67℃) (Norbeck and Latimer, 2023). Note: GEOPHIRES enforces a thermodynamic optimum that overrides higher values, such as the 85°C ORC outlet temperature specified in Cape Station’s plant design (DeGolyer and MacNaughton, 2024) (intended for silica scaling mitigation), resulting in a “maximum theoretical power” scenario. Support for higher reinjection temperatures may be added in future GEOPHIRES versions. |
Injection Wellbore Temperature Gain |
3 ℃ |
Empirical estimate for high-flow rate wells where rapid fluid velocity minimizes heat uptake during descent (Ramey, 1962). |
Maximum Drawdown |
0.25% |
This value represents the fractional drop in production temperature compared to the initial temperature that is allowed before the wellfield is redrilled. It is calibrated to maintain the PPA minimum net electricity generation requirement. It is a very small percentage because it is relative to the initial production temperature; the temperature quickly rises higher due to thermal conditioning and plateaus until breakthrough, so any drawdown relative to the initial value signals that the temperature has already declined from its stabilized peak. |
Surface Plant Parameters¶
Parameter |
Input Value |
Comment |
|---|---|---|
Power Plant Type |
Supercritical ORC |
Gen 2 ORC units (Turboden, 2025). |
Plant Lifetime |
30 yr |
Sets the project economic horizon, aligned with Fervo’s anticipated 30-year well life (Fervo Energy, 2025a). Modeling Distinction: While Fervo projects physical wellbore integrity for 30 years, GEOPHIRES simulates “redrilling events” to model thermal management of the reservoir volume. This treats the 30-year lifespan as an aggregate of shorter-lived thermal cycles delineated by discrete redrilling events occurring at intervals dictated by the Maximum Drawdown parameter. The modeled cost of each redrilling event is equivalent to the drilling and stimulation cost of the entire wellfield, serving as a conservative cost proxy for the major interventions (e.g., sidetracking and stimulating laterals into fresh rock, or drilling new wells if necessary) required to sustain the PPA target against thermal depletion. Fervo describes its approach as a makeup-well drilling program in which later wells benefit from cumulative learnings (Fervo Energy, 2026f). |
Ambient Temperature |
11.17 ℃ |
Average annual temperature of Milford, Utah (NCEI). Note that this value affects heat to power conversion efficiency. The effects of hourly and seasonal ambient temperature fluctuations on efficiency and power generation are not modeled in this version of the case study. |
Utilization Factor |
91.3% |
(DeGolyer and MacNaughton, 2024) |
Plant Outlet Pressure |
2000 psi |
McClure, 2024; Singh et al., 2025. |
Circulation Pump Efficiency |
80% |
|
Project Latitude |
38.506196 |
|
Project Longitude |
-112.918155 |
Construction Parameters¶
Parameter |
Input Value |
Comment |
|---|---|---|
Construction Years |
4 yr |
Fervo’s FOAK timeline at Cape Station ran from ground breaking in September 2023 (Fervo Energy, 2023b) to expected full-scale production in 2028 (Fervo Energy, 2025c), which the February 2026 Update modeled as 5 years. Phase I (approximately 100 MWe in three 33 MWe GeoBlocks) reached first power in September 2026, three years after ground breaking (Fervo Energy, 2026e). The first GeoBlock declared commercial operation on September 30, 2026, one day before its contractual COD; the other two are expected to reach contractual COD by January 1, 2027, and Phase II (400 MWe) is under construction with expected COD in 2028 (Fervo Energy, 2026j). A SOAK developer is modeled with one fewer year: Fervo reports Phase I went from site preparation to a constructed power unit in under two years (Fervo Energy, 2026f), built and commissioned the first GeoBlock’s power facility in 23 months, and expects an 18-month construction timeline for future GeoBlocks (Fervo Energy, 2026j). Fervo also estimates that at steady state each of its three rigs could drill about 1.5 wells per month (Fervo Energy, 2026f), a pace at which this case study’s 84-well initial campaign takes roughly 19 months. See GEOPHIRES documentation for details on how construction years affect CAPEX, IRR, and other calculations. |
Construction CAPEX Schedule |
0.041,0.139,0.431,0.389 |
Array of fractions of overnight capital cost expenditure for each year, starting with lower costs during initial years for exploration and increasing to higher costs during later years as buildout progresses. |
Economic Parameters¶
Parameter |
Input Value |
Comment |
|---|---|---|
Economic Model |
SAM Single Owner PPA |
The SAM Single Owner PPA economic model is used to calculate financial results including LCOE, NPV, IRR, and pro-forma cash flow analysis. See GEOPHIRES documentation of SAM Economic Models for details on how System Advisor Model financial models are integrated into GEOPHIRES. |
Inflation Rate |
3% |
US CPI-U was 3.4% year over year in August 2026 (core 2.4%) (BLS, 2026b), down from 4.2% in May 2026, when the energy index was up 23.5% year over year (BLS, 2026a). 3.0% is between core and headline and above the Federal Reserve’s 2% target, a conservative assumption for a 30-year horizon. The February 2026 Update used 2.7%, US inflation as of December 2025. Note: 2024b ATB models lower inflation. GEOPHIRES holds fixed O&M flat in nominal terms; inflation affects capital cost escalation during construction and the nominal discount rate. |
Starting Electricity Sale Price |
$115/MWh |
Midpoint of the $100-130/MWh range Fervo reports for contracts currently under negotiation, of which approximately half are with hyperscale data center buyers (Fervo Energy, 2026f; 2026g). Above the prices implied by Fervo’s existing contracts: Corsac Station’s 15-year PPA at $107/MWh (CTVC, 2025), and Fervo’s company-wide revenue backlog of approximately $7.2B across 658 MW of binding PPAs (Fervo Energy, 2026g), which implies roughly $91/MWh assuming 15-year terms at 91.3% capacity factor. Pricing for the subsequent 396 MW Google PPA was not disclosed (Fervo Energy, 2026b). The SOAK project is assumed to contract in 2026 or later for a 2030 commercial operation date. The February 2026 Update used $95/MWh, aligned with Geysers - Sacramento pricing in 2024b ATB (NREL, 2025). See Sensitivity Analysis for effect of different prices on results. |
Electricity Escalation Rate Per Year |
$1.83/MWh |
$1.83/MWh per year. GEOPHIRES supports only linear (additive) escalation; this value reproduces the 15-year present value, at the case study WACC of approximately 9.2%, of a 1.5% per year compounding escalator on the $115/MWh starting price. 1.5% is the escalator in Ormat’s 2025 Heber 1 geothermal PPA (CTVC, 2025); Fervo’s PPA escalation terms are not disclosed. Reaches $140.6/MWh in operating year 15 versus $141.7/MWh under compounding. The February 2026 Update used $0.57/MWh per year, calibrated to reach $100/MWh at project year 11 from a $95/MWh start. |
Fraction of Investment in Bonds |
62% |
Sized for a minimum pre-tax debt service coverage ratio (DSCR) of at least 1.35, the 2024b ATB geothermal value (NREL, 2025), at the 18-year Debt Tenor. The resulting minimum DSCR is 1.36, in operating year 1; the effective debt share of total installed cost is 61.4%, slightly lower because the first construction year is equity-only. The February 2026 Update used 0.7, approximately the debt required to cover CAPEX after $1 billion sponsor equity per Matson, 2024, with debt amortized over the 30-year plant lifetime; at the 18-year tenor, 0.7 would give a minimum DSCR of 1.21. Matson also reports that Fervo ultimately wants to target “15% sponsor equity, 15% bridge loan, and 70% construction to term loans”; this case study does not attempt to model that capital structure precisely. Reference: Fervo closed a $421.4M non-recourse project debt facility (the Project Granite Facility) for Cape Station Phase I in Q1 2026 (Fervo Energy, 2026a; 2026c). Its $309M construction-to-term loan (Fervo Energy, 2026i) is roughly 44% of the approximately $7,000/kW FOAK cost of the roughly 100 MW Phase I (Fervo Energy, 2026d; 2026e); the rest of the facility is a tax credit bridge loan and letter of credit facilities. Fervo also entered into an agreement with Liberty Mutual to monetize Phase I tax credits, providing additional non-sponsor capital (Fervo Energy, 2026c). |
Discount Rate |
12% |
Typical discount rates for higher-risk projects may be 12–15%. This is a real (inflation-adjusted) rate; the SAM Economic Model discounts nominal cash flows at the equivalent nominal rate, (1 + discount rate) × (1 + inflation rate) − 1. |
Inflated Bond Interest Rate |
7% |
2024b ATB (NREL, 2025) |
Debt Tenor |
18 yr |
The 2024b ATB debt amortization assumption, “a common debt amortization period for U.S. renewable energy projects, even if the term of debt is shorter” (NREL, 2025), and the SAM default. It extends 3 years beyond the approximately 15-year remaining terms of Fervo’s binding PPAs (Fervo Energy, 2026d) and the case study’s 15-year PPA, so debt service in operating years 16-18 relies on the post-PPA price (see Ending Electricity Sale Price); DSCR in those years is 1.80. Fervo’s Phase I construction-to-term loan is a bank mini-perm maturing March 31, 2031, with quarterly amortization and a balloon at maturity (Fervo Energy, 2026h); the level-payment tenor modeled here stands in for its undisclosed amortization profile. A 15-year tenor matching the PPA term is the conservative case. Counted from COD. The February 2026 Update repaid debt over the 30-year plant lifetime, the only option before GEOPHIRES 3.18. |
Inflated Bond Interest Rate During Construction |
10.5% |
Higher than interest rate during normal operation to account for increased risk of default prior to COD. Value aligns with ATB discount rate (NREL, 2025). |
Bond Financing Start Year |
-2 yr |
Equity-only for the first construction year. The 4-year schedule merges the first two years (exploration and early development) of the 5-year DOE-ATB hybrid schedule, so the equity-only share of overnight capital cost (4.1%) is unchanged from the February 2026 Update, which was equity-only for the first 2 of 5 construction years (ATB). |
Investment Tax Credit Rate |
30% |
Statutory rate; Geothermal Drilling and Completions Apprenticeship Program ensures compliance with ITC labor requirements (Southern Utah University, 2024). GEOPHIRES’s SAM Single Owner PPA model applies this rate to total installed cost, which includes the interconnection cost entered under One-time Flat License Fees Etc. Under IRC §48(a)(8) qualified interconnection property is in the ITC basis only for energy property of 5 MW or less, so the model overstates the credit by approximately $86M (30% of the $287M interconnection cost including its inflation and interest during construction); an equivalent rate of 0.2768 on total installed cost would remove it and reduces IRR by about 1.1 points. The statutory rate is retained for clarity because the overstatement is offset in direction, and likely in magnitude, by an unmodeled benefit on the same line item: in non-ISO balancing authorities such as PacifiCorp, network upgrade costs, the majority of interconnection cost, are often refunded to the interconnection customer over up to 20 years with interest once the plant reaches commercial operation (Seel et al., 2026). Taxpayer-owned point-of-interconnection facilities may also qualify as integral power conditioning and transfer equipment regardless of project size, which would reduce the overstatement further. |
Combined Income Tax Rate |
25.55% |
Federal Corporate Income Tax Rate of 21% plus Utah Corporate Franchise and Income Tax Rate of 4.55%. (Note: This input uses a simple summation of statutory rates; the effective combined rate calculated in the model may differ due to standard federal-state tax interactions.) |
Property Tax Rate |
0.22% |
Utah Inland Port Authority (UIPA) tax differential incentive |
Depreciation Schedule |
5-year MACRS |
5-year MACRS, the statutory depreciation class for facilities that claim the technology-neutral clean electricity credits (IRC sections 48E and 45Y); geothermal facilities that begin construction by the end of 2033 receive the full credit (Norton Rose Fulbright, 2025). The SAM Single Owner model counts the resulting early-year tax losses as tax benefits in the years they occur, which assumes the owner can use them, for example through a tax equity partner; the 2024b ATB likewise assumes tax benefits are used efficiently through tax equity (NREL, 2025). Allocating the entire depreciable basis to 5-year MACRS slightly overstates the benefit, since the interconnection cost would be depreciated over a longer life (about 0.4 percentage points of IRR). The February 2026 Update used 20-year straight line. |
Capital Cost for Power Plant for Electricity Generation |
$1900/kW |
US DOE, 2021. Pricing information not publicly available for Turboden or Baker Hughes Gen 2 ORC units (Turboden, 2025; Jacobs, 2025). Note: Fervo states that drilling, completion and well pad facilities are about half of pre-COD CAPEX and surface power generation equipment about half (Fervo Energy, 2026f); this case study yields roughly 47% subsurface (drilling, completion, stimulation and gathering) / 53% surface plant, excluding interconnection and exploration, so the plant cost may be modestly overstated and/or the well costs understated relative to Fervo’s actuals. |
Exploration Capital Cost |
$56M |
Equivalent to 2024b ATB NF-EGS conservative scenario exploration assumption of 5 full-size wells (NREL, 2025) at this case study’s all-in well cost of $8.48M, plus $1M for geophysical and field work, plus 15% contingency, plus 12% indirect costs: (5 × $8.48M + $1M) × 1.15 × 1.12 = $55.9M. The February 2026 Update used $30M, derived the same way from a $4.65M well. Recompute this value whenever the per-well drilling and completion cost changes. |
Well Drilling Cost Correlation |
vertical large diameter, baseline |
2025 NREL Geothermal Drilling Cost Curve Update (Akindipe and Witter, 2025). |
Well Drilling and Completion Capital Cost Adjustment Factor |
72% (Yields all-in cost of $8.48M/well) |
Applied to both the vertical correlation and the lateral cost. Yields $8.5M/well all-in (vertical $4.40M + lateral $4.08M, each including 5% indirect costs) versus $11.8M at factor 1.0 for the 3.06 km TVD, 7,500 ft lateral geometry. Calibration: Fervo’s first Cape Station well ($9.4M) and best Phase I well ($4.8M), both 5,000 ft lateral 2.0-design wells, correspond to factors of 1.14 and 0.58 respectively against the same correlation with the lateral costed explicitly. The SOAK value of 0.72 is the geometric mean of the ATB-aligned baseline (0.9) and Fervo’s best demonstrated well (0.58), decomposing as 0.70 for a fast follower’s learning position times 1.029 for the temperature adjustment at 221℃ (NREL 2025 drilling cost curves). It is about 4% above the INTERMEDIATE1 drilling technology scenario (US DOE, 2019) at factor 1.0 ($8.1M/well for the same geometry, with the lateral at that scenario’s per-meter cost). Fervo cites batch drilling among its drilling efficiency gains, reports a record 21-day spud-to-total-depth time on the Sawtooth 7 well, and has trialed rotary steerable systems on deeper wells (Fervo Energy, 2026a; 2026f). Reference points: 0.58 ($6.8M/well) for Fervo-demonstrated performance; 0.9 ($10.6M/well) for the unadjusted ATB baseline; Latimer’s stated target of under $4M/well (Latimer, 2025) corresponds to roughly 0.35 and is treated as a NOAK aspiration rather than a SOAK comparable. Note: the February 2026 Update used 0.9 on the vertical correlation only with the lateral folded in, which yielded $4.65M/well at 2.68 km; against the lateral-inclusive correlation that was an effective factor of about 0.58, i.e. Fervo’s best demonstrated well rather than a conservative SOAK assumption. See Sensitivity Analysis for effect of different drilling costs on results. |
All-in Nonvertical Drilling Costs |
$2360/m |
USD per meter of lateral before the adjustment factor and indirect costs. Value from the 2025 NREL geothermal drilling cost curve (Akindipe and Witter, 2025) for the vertical large diameter baseline correlation at 3.06 km, as computed by the SWS Geothermal Platform drilling cost calculator; the calculator assumes the same per-meter cost for lateral and vertical sections. Scaled by the Well Drilling and Completion Capital Cost Adjustment Factor and by Multilaterals Cased. |
Reservoir Stimulation Capital Cost per Fracture Surface Area |
$0.875/m² baseline cost; $7.25M/well all-in cost |
USD per square meter of nominal (single-face, planar) fracture area, before adjustment factor, indirect costs and contingency; GEOPHIRES multiplies by Fracture Width × Fracture Height × Number of Fractures per Stimulated Well × number of stimulated wells. Equivalent to $4M per 12-stage 5,000 ft lateral (150 fractures) and $6M per 18-stage 7,500 ft lateral (225 fractures) at the case study fracture geometry, i.e. the same per-stage calibration used in the February 2026 Update: high-intensity U.S. shale wells (Baytex Energy, 2024; Quantum Proppant Technologies, 2020), the closest technological analogue for multi-stage EGS (Gradl, 2018). Costs are also driven by the requirement for high-strength ceramic proppant rather than standard sand, which would crush or chemically degrade (diagenesis) over a 30-year lifecycle at 200℃ (Ko et al., 2023; Shiozawa and McClure, 2014) and the premium for ultra-high-temperature (HT) downhole tools. Fervo also reports sourcing equipment to pump at the higher pressures required by the deeper Phase II wells (Fervo Energy, 2026f). Parameterizing by area rather than per well makes stimulation cost track fracture count and geometry automatically in sensitivity and variant scenarios. Note that all-in costs per well are higher than the direct cost because they include indirect costs and contingency. See Sensitivity Analysis for effect of different stimulation costs on results. |
Reservoir Stimulation Capital Cost per Production Well |
Stimulated (cost from per-area input) |
Indicates that production wells are stimulated (in addition to injection wells, which GEOPHIRES stimulates by default); the per-area cost is then apportioned across all wells. |
Field Gathering System Capital Cost Adjustment Factor |
54% |
Gathering costs represent 2% of facilities CAPEX per Matson, 2024. |
One-time Flat License Fees Etc |
$250M |
Grid interconnection cost (point-of-interconnection facilities plus transmission network upgrades), $500/kW for 500 MWe. Based on PacifiCorp cluster-study cost estimates for recent geothermal interconnection requests in Beaver and Millard Counties, Utah: $417/kW (ERIS) to $500/kW (NRIS) for a 40 MW request in Beaver County (2021 study) and $450/kW for a 40 MW request in Millard County (2022 study); recent requests of 250-750 MW across PacifiCorp, BPA and Duke averaged $426/kW, and projects with high interconnection costs cluster along the same transmission lines, especially in southern Utah and Wyoming (Seel et al., 2026). The NRIS figure is used because the PPA structure requires firm delivery. Fervo’s actual Cape Station interconnection cost is not publicly disclosed; an MLQ.ai analysis of Fervo’s IPO filing, reported by Utility Dive, puts Fervo’s Cape Station Phase II interconnection and transmission rights at approximately 290 MW against 384 MW of contracted capacity (Utility Dive, 2026). GEOPHIRES adds this parameter to overnight capital cost without indirect cost or contingency loading, spreads it over the construction schedule with inflation and interest during construction, and includes it in the depreciable and property-tax basis. Not modeled: in non-ISO balancing authorities such as PacifiCorp, network upgrade costs paid up front are often refunded to the interconnection customer over up to 20 years with interest once the plant reaches commercial operation (Seel et al., 2026), so the value here is conservative. The February 2026 Update did not include interconnection cost (see the Discussion section of the case study documentation). |
Annual License Fees Etc |
$27M/yr |
Long-term firm point-to-point transmission service for 500 MW, $M per year, held flat in nominal terms by GEOPHIRES. PacifiCorp’s projected OATT transmission formula rate (FERC docket ER11-3643) effective June 1, 2025 is $52.92/kW-year (Rocky Mountain Power, 2026), plus Schedule 1 (scheduling, system control and dispatch) at the June 2017 rate of $801/MW-year (PacifiCorp, 2017) escalated at 3% per year to 2025 (about $1,000/MW-year): approximately $53,900/MW-year, applied to the 500 MW contracted capacity. The rate effective June 2026 (2026 Transmission Formula Annual Update, FERC docket ER26-2546) was not available. Reserving the 525 MW maximum net output gives $28.3M/year. For comparison, PacifiCorp’s June 2017 Schedule 7 (firm point-to-point) rate of $32,029/MW-year plus Schedule 1 gives $16.4M/year (PacifiCorp, 2017), and BPA’s long-term firm point-to-point rate for fiscal years 2026-2028 is $2.043/kW-month, about $24,500/MW-year (BPA, 2025). Assumes delivery within or at the edge of PacifiCorp’s system; delivery to a CAISO offtaker across an intervening system (e.g. the Intermountain HVDC line or NV Energy) would add a second firm reservation and charge. Transmission losses (in kind) are not included. Insurance premiums, which the case study documentation lists as unmodeled, are not included in this value. |
Royalty Rate |
1.75% |
The BLM royalty structure is 1.75% of gross proceeds from electricity sales for the first 10 years of production (Code of Federal Regulations, 2024). |
Royalty Rate Escalation Start Year |
11 yr |
After the first 10 years of production, the royalty rate escalates to 3.5%. |
Royalty Rate Escalation |
1.75% |
Escalation at Year 11 from 1.75% to 3.5%. |
Royalty Rate Maximum |
3.5% |
No further escalation beyond 3.5%. |
Water Cost Adjustment Factor |
200% |
Local scarcity may increase procurement costs. Development near/on land with active/shut-in oil and gas wells could potentially utilize waste water to recover losses and offset costs. |
Redrilling Learning Rate |
10% |
Each doubling of the number of wellfields drilled at the site cuts the cost of the next by 10%, so the first redrill costs 90% of the original wellfield and the eighth 72%. At Cape Station, the first six horizontal wells improved by 15% (drilling days) to 20% (cost) per doubling, but there and in other fields the gains level off after the first wells, and geothermal well costs flatten at 70 to 75% of the first well’s (El-Sadi et al., 2024, as tabulated by Akindipe and Witter, 2025, Lowry et al., 2017, Kellogg, 2009). |
Calibration with Fervo-implemented Field Design¶
Designing the Record-Breaking Enhanced Geothermal System at Project Cape (Singh et al., 2025) describes reservoir modeling (ResFrac) that informed the Cape Station field implementation[2].
Bench Design and Well Spacing¶
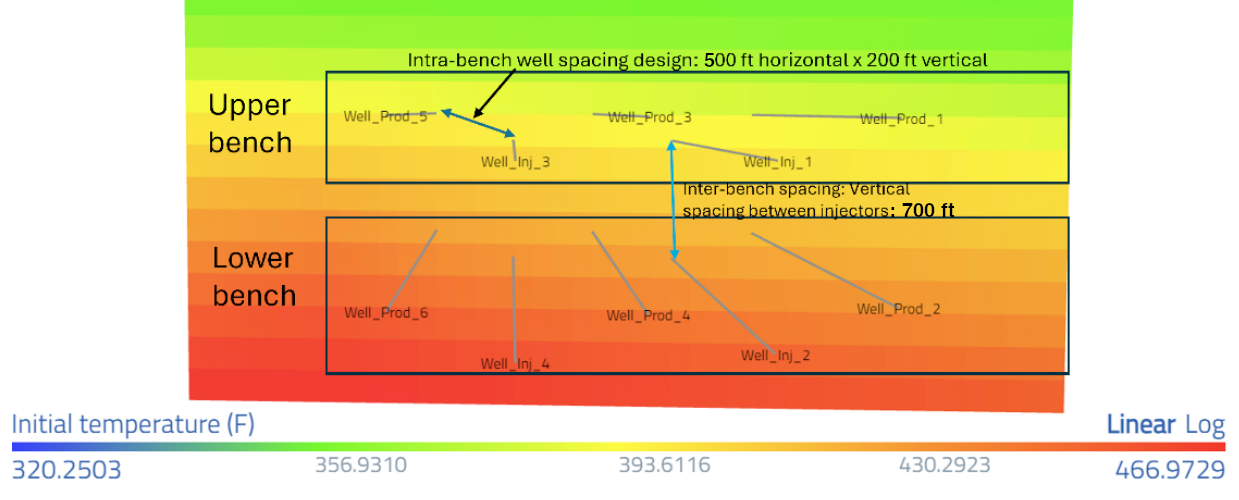
Figure 7 in Singh et al., 2025 (below) shows the well and bench spacing for the Cape Station field design.[3]
Each bench consists of 5 wells, with 2 injectors and 3 producers.
This ratio is encoded by the case study’s Number of Injection Wells per Production Well parameter (see Well Bores Parameters).
The Singh et al. paper models separate upper and lower benches.
GEOPHIRES does not support wells with different depths, so the case study uses a single Reservoir Depth.
The February 2026 Update set it to 2.68 km, an approximate average depth between the upper and lower benches of the Phase I
design.
The current version sets it to 3.06 km, the depth at which the segmented gradient reaches the 430℉ (221℃) average
reservoir temperature of the Fervo 3.0 well design used for Phase II (Fervo Energy, 2026f; 2026g).
The comparison with Singh et al. below is run at the previous depth so that it remains a
like-for-like comparison with the Phase I design simulated by Singh et al.
See the Technical & Engineering Results section for relevant temperature results.
Fracture Geometry¶
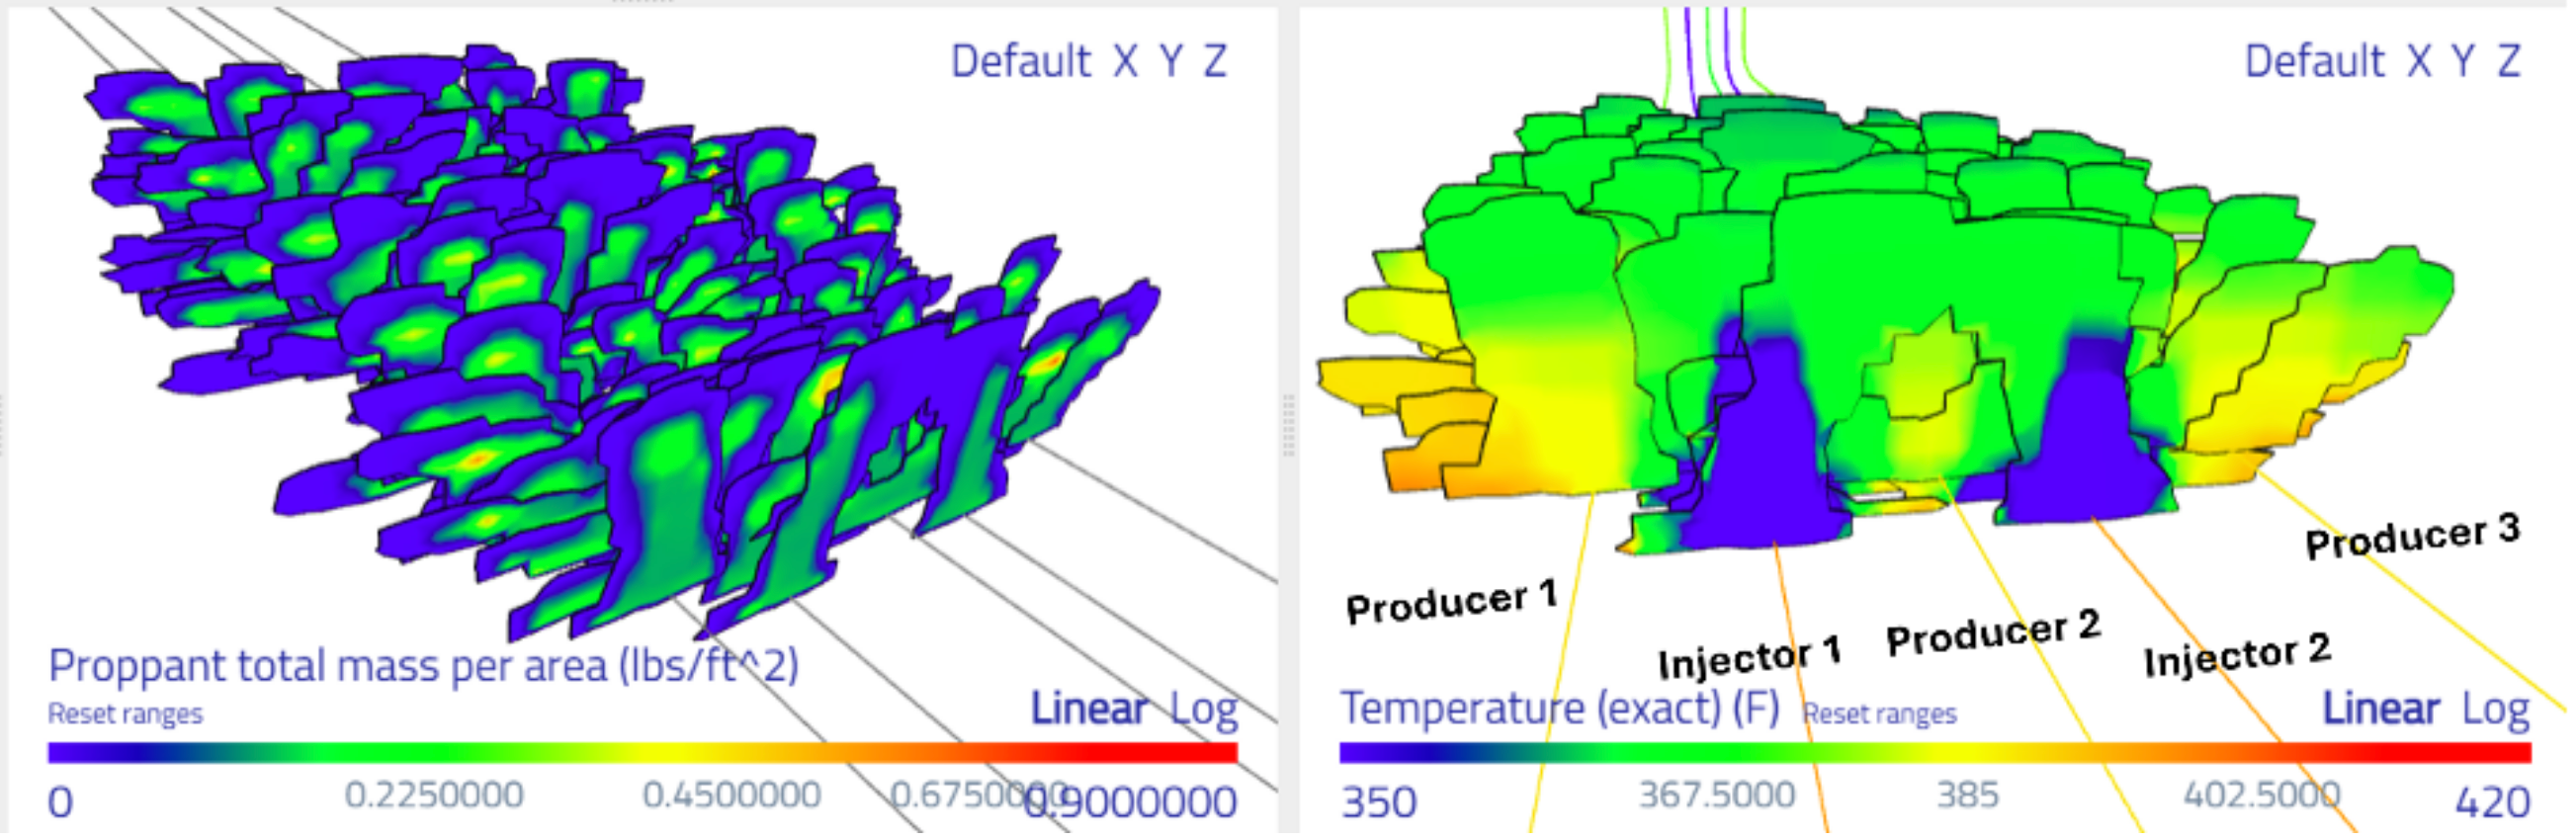
Figure 2 in Singh et al., 2025 (below) shows the ResFrac simulated fracture geometry. This figure, along with the bench design in Figure 7,
informed the case study’s Fracture Shape, Fracture Width, Fracture Height, and Number of Fractures per Stimulated Well parameters (see Reservoir Parameters).
Note that the case study does not attempt to strictly replicate the paper’s fracture geometry;
rather, the paper specifications were used to derive approximations and/or constraints on parameters whose final values
were ultimately refined based on holistic techno-economic considerations. For example, the intra-bench horizontal well spacing
of 500 ft dictates that fracture half-lengths must be at least 500 ft in order to achieve flow between injectors and producers.
Thus, a minimum fracture length of 1000 ft (305 m) is required (assuming that fractures propagate approximately symmetrically in the horizontal axis),
reflected in the case study’s Fracture Width parameter value.
Similarly, the intra-bench vertical spacing of 200 ft (61 m) dictates that the fracture height must be at least 200 ft[4].
The case study’s Fracture Height value was formulated by starting with 61 m and then iteratively uprating until a total effective fracture surface area per well was achieved
that produces results consistent with the paper simulation and other reference values.
The uprated value is also supported by Figure 2’s fracture geometry visualization indicating fracture height exceeding intra-bench vertical spacing.
Simulation Comparison¶
An equivalent GEOPHIRES simulation was run using the case study’s reservoir engineering parameters, with the following modifications to align with Singh et al.’s modeling scenario:
Parameter |
Input Value |
Comment |
|---|---|---|
Number of Production Wells |
4 |
|
Number of Injection Wells per Production Well |
1.2 |
The Singh et al. scenario has 4 producers and 6 injectors. We model one fewer injector here to account for the combined injection rate being lower for the higher bench separation cases. |
Maximum Drawdown |
100% |
Redrilling not modeled in Singh et al. scenario. (The equivalent GEOPHIRES simulation allows drawdown to reach up to 100% without triggering redrilling) |
Plant Lifetime |
15 yr |
|
Reservoir Depth |
2.68 km |
Approximate average depth between the upper and lower benches of the Phase I design simulated by Singh et al. The case study base case is deeper, corresponding to the Fervo 3.0 well design. |
Nonvertical Length per Multilateral Section |
5000 feet |
Phase I lateral length (BLM, 2024). The case study base case uses the longer lateral of the Fervo 3.0 well design. |
Number of Fractures per Stimulated Well |
150 |
12 stages for the 5,000 ft Phase I lateral at the case study stage length, clusters per stage, and stimulation success rate. The case study base case scales the stage count to the longer 3.0 design lateral. |
The overrides for depth, lateral length, and fracture count return the scenario to the Phase I design simulated by Singh et al.; the base case’s 3.0 design (deeper, with longer laterals and 50% more fracture surface area per well) has no published numerical simulation counterpart to compare against.
The following table compares the average production temperature profile from the “700 ft bench spacing” scenario in Singh et al. with the GEOPHIRES simulation. Note that both figures show temperature in Fahrenheit rather than Celsius.
Reference Simulation: Fervo-implemented Design (Fig. 18.) |
GEOPHIRES Simulation: Case Study Equivalent Scenario |
|---|---|
|
|
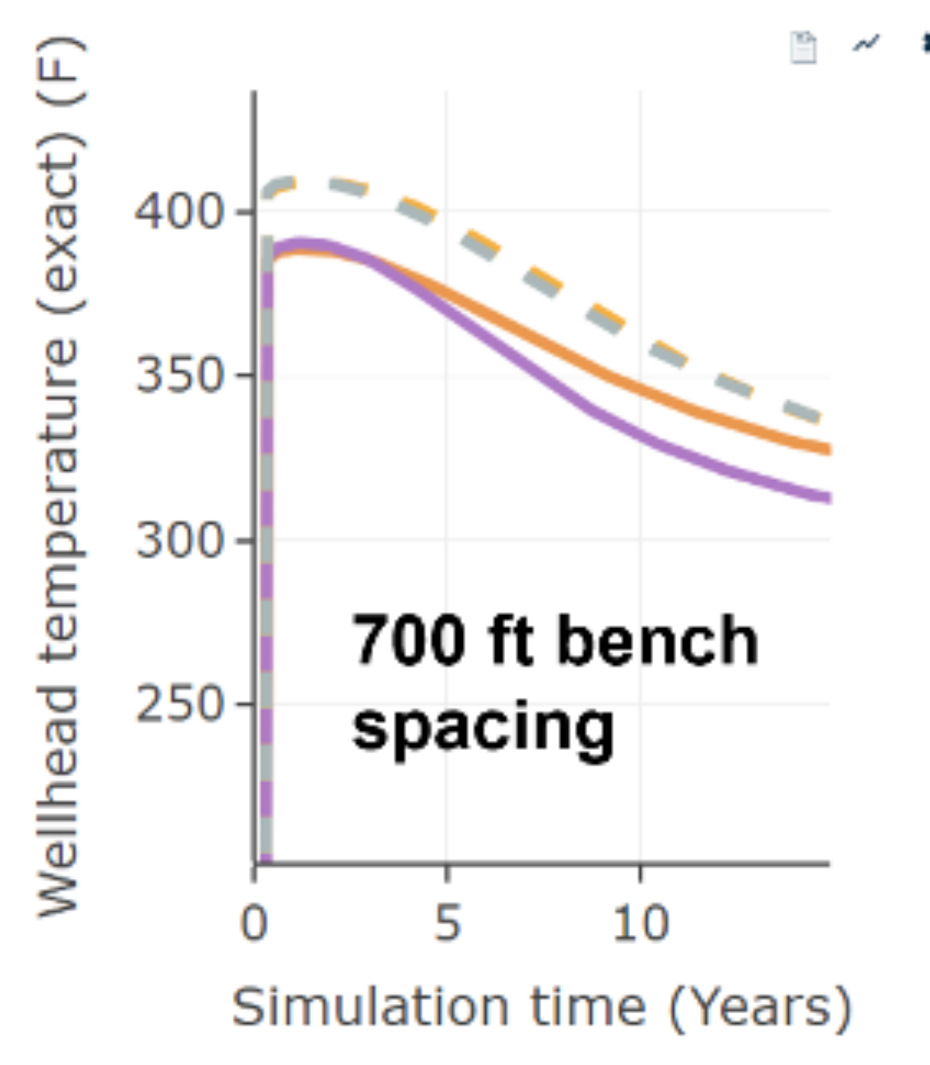
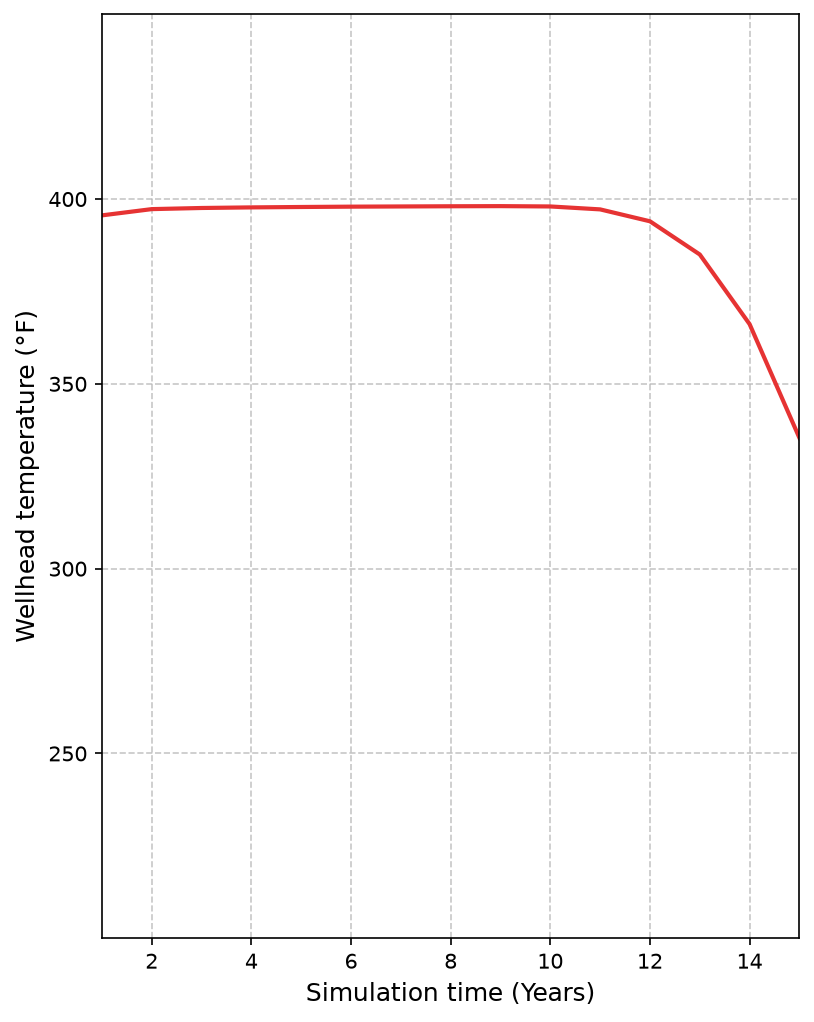
While the initial and final (Year 15) temperatures are consistent, the production curves exhibit distinct profiles due to the different modeling approaches:
Reference Simulation (Left): The Singh et al. (2025) curve reflects a fully coupled numerical simulation (ResFrac) that accounts for complex fracture heterogeneity, inter-well interference, and variable flow paths. The gradual decline starting around Year 3 indicates thermal dispersion, where cold injection fluid mixes with hot reservoir fluid along faster flow paths earlier in the project life.
GEOPHIRES Simulation (Right): The GEOPHIRES result utilizes the Gringarten (1975) analytical solution for flow in fractured rock. This model assumes a uniform thermal sweep across an idealized fracture surface. Consequently, it maintains a flat, maximum production temperature for a longer duration until the cold front reaches the production well (thermal breakthrough), resulting in a sharper, later decline.
Despite these structural differences, the comparison supports the physical plausibility of the case study’s reservoir engineering parameters, as the Year 1 and Year 15 thermal endpoints align closely with the numerical simulation baseline.
However, the analytical Gringarten model’s thermal plateau yields a higher aggregate heat extraction than the numerical model’s gradual decline, representing an optimistic upper bound on performance compared to the conservative heterogeneity modeled in ResFrac (see Reservoir Modeling Fidelity in the Discussion section).
The calibration simulation above represents a 15-year unmitigated thermal decline without redrilling. In the full case study results, the model includes redrilling events that restore production temperature when drawdown thresholds are reached, resulting in the cyclical profile shown in the Production Temperature section below.
Results¶
See Fervo_Project_Cape-7.out in source code for the complete results. Refer to the GEOPHIRES Parameters reference for descriptions and specifications of all available GEOPHIRES outputs.
Economic Results¶
Note that economic results are derived from the SAM Single Owner PPA Economic Model pro-forma cash flow analysis.
The case study result’s pro-forma cash flow analysis can be viewed in the Fervo_Project_Cape-7.out result file in source code
and in the web interface under the Cash Flow tab.
Metric |
Result Value |
Reference Value(s) |
Reference Source |
|---|---|---|---|
LCOE |
$109.2/MWh |
$80/MWh; |
Horne et al, 2025; Lazard, 2026. |
Levelized PPA Price |
$125.1/MWh |
$100–130/MWh |
Price range Fervo reports for contracts under negotiation (Fervo Energy, 2026f). See the PPA price discussion in Sensitivity Analysis for the relationship between PPA price and LCOE. |
After-tax IRR |
21.5% |
15–25% |
Typical levered returns for energy projects |
NPV |
$278.7M |
>$0 |
Positive NPVs result in profit. Cash flows are discounted at the 12% real discount rate (15.4% nominal); see Discount Rate in Economic Parameters. |
Levered Equity |
1.26 |
>1.0 |
Calculations greater than 1.0 indicate the future anticipated discounted cash inflows are greater than the anticipated discounted cash outflows. |
Project ROI |
4.22 |
||
Cash Flow |
Hover over the metric names to view the corresponding definitions. See GEOPHIRES Economic Outputs documentation for more information.
Capital Costs (CAPEX)¶
Metric |
Result Value |
Reference Value(s) |
Reference Source |
|---|---|---|---|
WACC |
9.17% |
8.3% |
Fervo’s target goal is to eventually achieve a “Solar Standard” WACC of 8.3% (Matson, 2024). |
Exploration Costs |
$56M |
$42.4M |
2024b ATB NF-EGS conservative scenario exploration assumption of 5 full-size wells (NREL, 2025) at the case study’s all-in well cost. Case study result conservatively includes additional costs for geophysical survey, indirect costs, and contingency. |
Well Drilling and Completion Costs |
$712M total |
$4.8M–$9.4M/well; |
Fervo Phase I wells with 5,000 ft laterals, best to first (InnovationMap); 2025 NREL drilling cost curve baseline (adjustment factor of 1.0) for the case study’s 3.0 design well geometry (Akindipe and Witter, 2025); NOAK target (Latimer, 2025). |
Stimulation Costs |
$609M total |
$9.95M/well |
Based on 46%:54% drilling:stimulation cost ratio (Yusifov & Enriquez, 2025) applied to the case study’s drilling and completion cost per well. |
Surface Power Plant Costs |
$1.55B |
~50% of pre-COD CAPEX |
Fervo reports surface power generation equipment as about half of pre-COD CAPEX, with drilling, completion and well pad facilities the other half (Fervo Energy, 2026f). The case study’s surface power plant cost is 53% of drilling, completion, stimulation, field gathering, and surface power plant costs combined (excluding exploration and interconnection). |
Field Gathering System Costs |
$50M |
2% of OCC |
Matson, 2024. |
Grid Interconnection Costs |
$250M |
$417–$500/kW; |
PacifiCorp cluster-study estimates for geothermal interconnection requests in Beaver and Millard Counties, Utah; average for 250–750 MW requests across PacifiCorp, BPA, and Duke (Seel et al., 2026). Entered as |
Overnight Capital Cost |
$3.23B |
||
Total CAPEX |
$3.71B |
||
Total CAPEX: $/kW |
$7100/kW |
$7000/kW; $5500/kW; $5000/kW; $4500/kW; $3000–$6000/kW |
Cape Station Phase I FOAK overnight capital cost (Fervo Energy, 2026d); Phase II all-in cost target (Fervo Energy, 2026a); McClure, 2024; Horne et al, 2025; Latimer, 2025. Fervo has not disclosed whether its figures include interconnection. |
Operating Costs (OPEX)¶
Metric |
Result Value |
Reference Value(s) |
Reference Source |
|---|---|---|---|
Wellfield maintenance costs |
$8.58M/yr |
The built-in correlation for the wellfield OPEX is similar as the surface plant OPEX: it assumes that it consists of 1% of the total wellfield plus field gathering system costs (for annual non-labor costs) and 25% of the labor costs (the other 75% of the labor costs are assigned to the surface plant OPEX). |
|
Power plant maintenance costs |
$26.18M/yr |
GEOPHIRES estimates the annual surface plant OPEX as the sum of 1.5% of the total plant capital cost (for annual non-labor costs), and 75% of the annual labor costs. The other 25% of the labor costs are assigned to the wellfield OPEX. The labor costs are calculated internally in GEOPHIRES using the 2014 labor costs provided by Beckers (2016), indexed to 2017 using the Bureau of Labor Statistics (BLS) Employment Cost Index for utilities (2018). The original 2014 labor cost correlation expresses the labor costs as a function of the plant size (MW) using an approximate logarithmic curve fit to the built-in labor cost data in GETEM. |
|
Water costs |
$2.85M/yr |
Default correlation: Assumes $3.50/1,000 gallons of water. The default correlation is adjusted by the Water Cost Adjustment Factor parameter value of 200%. |
|
Average Annual Royalty Cost |
$16.66M/yr |
The developer’s average annual royalty expense over the project’s operational lifetime. This value combines both production-based royalties (percentage of gross revenue) and any scheduled supplemental royalty payments. |
|
Redrilling costs |
$76.9M/yr |
Total redrilling costs over the Plant Lifetime are calculated as (Drilling and completion costs + Stimulation costs) × Number of times redrilling, reduced by Redrilling Learning Rate if provided. The total is then divided over Plant Lifetime years to calculate Redrilling costs per year. |
|
Annual License Fees Etc |
$27.0M/yr |
$16.4M/yr; ~$12M/yr |
Long-term firm point-to-point transmission service for 500 MW, entered as |
Total operating and maintenance costs |
$158.17M/yr |
||
Total operating and maintenance costs: $/kW-yr |
$300.71/kW-yr |
$226.31/kW-yr |
2024b ATB: 2028 Deep EGS Binary Conservative Scenario (NREL, 2025). The case study value includes transmission service ($51/kW-yr); excluding it, total OPEX is $249/kW-yr. |
Technical & Engineering Results¶
Metric |
Result Value |
Reference Value(s) |
Reference Source |
|---|---|---|---|
Minimum Net Electricity Generation |
511 MW |
500 MW |
The announced 500 MWe capacity (Fervo Energy, 2025b) is interpreted to mean that the PPA penalizes Cape Station if net electricity generation falls below 500 MWe. |
Average Net Electricity Generation |
524 MW |
||
Maximum Net Electricity Generation |
526 MW |
||
Maximum Total Electricity Generation |
635 MW |
Upper bound: 660 MW |
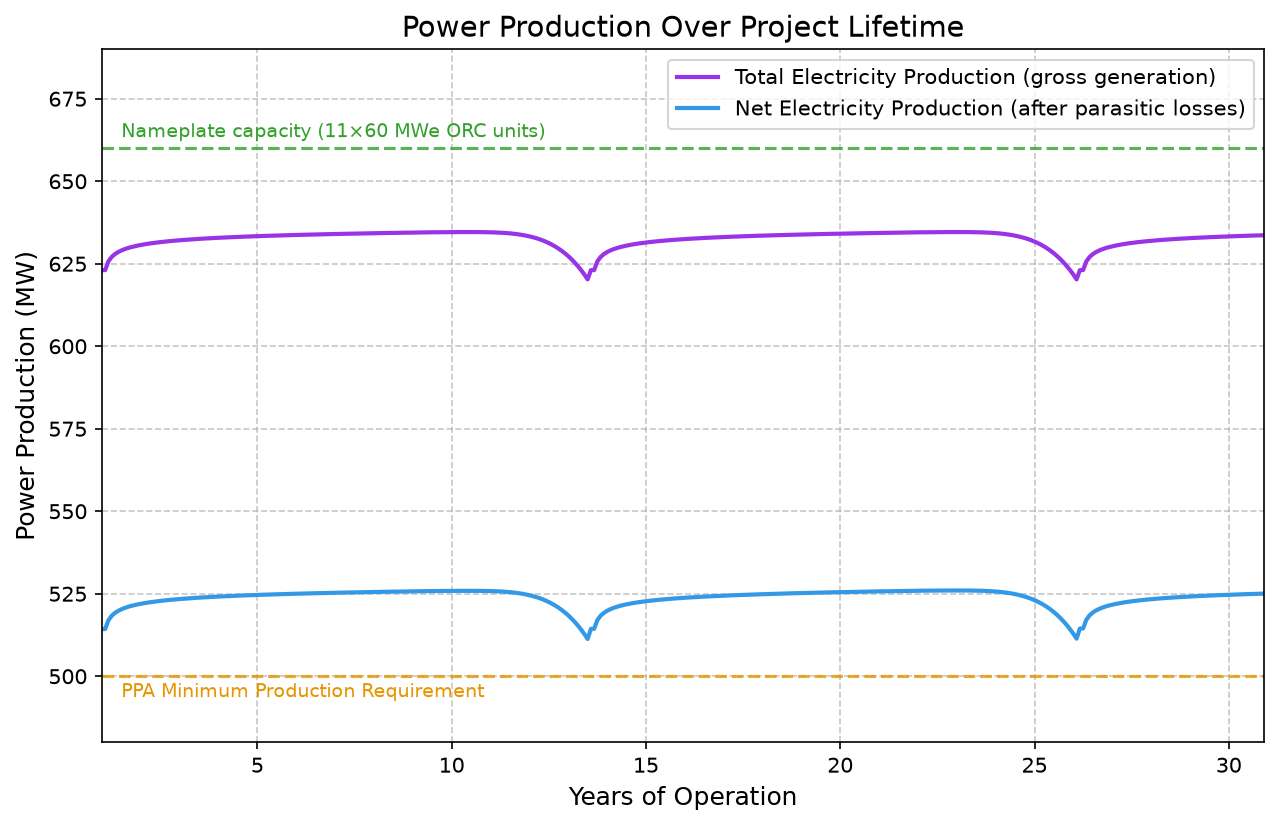
Combined nameplate capacity of 11×60 MWe Gen 2 ORCs. Phase II comprises eight 50 MWe (net) GeoBlocks (Fervo Energy, 2026a) served by 8×60 MWe Gen 2 ORCs, 3 from Turboden and 5 from Baker Hughes (Turboden, 2025; Jacobs, 2025). This equates to 480 MW gross capacity for Phase II’s 400 MW net capacity. At the parasitic load modeled in this case study (17.2% of total generation; see Pumping Parasitic Load below), 500 MWe net requires more than 600 MW gross, so an equivalent SOAK 500 MW project would require 11 Gen 2 ORC units. The February 2026 Update assumed 10 units at a parasitic load of about 15%. (Note that the modular Gen 2 ORCs are not individually modeled in this case study, and are assumed to be combined into a single power plant.) |
2-year Average Net Power Production per Production Well |
10.4 MW |
7.6–11.5 MW; |
Figures 4 and 12 (Singh et al., 2025); gross power per production well for the Fervo 3.0 well design (Fervo Energy, 2026g). The case study value is net of pumping parasitic load, and the Fervo figure appears to require flow rates above the 107 kg/s per well modeled in this case study. |
Heat to Power Conversion Efficiency |
14.5% |
19.5% (Likely omits internal plant parasitic loads, such as condenser fans, which GEOPHIRES explicitly accounts for.) |
DeGolyer and MacNaughton, 2024. |
Pumping Parasitic Load |
17.2% |
16.7%; |
The Phase II procurement strategy (480 MW gross / 400 MW net) implies a design ceiling of 16.7% for total on-site consumption (including injection pumping). Current SOAK targets for parasitic consumption range from 15–20%, reflecting a planned reduction from the ~25–35% observed in Phase I operations (Norbeck, 2026). The case study models parasitic load above the design ceiling because observed Phase I performance is well above it: the Productivity Index and Injectivity Index inputs are derated to place pumping power (production and injection) at 20% or more of net generation (see Reservoir Parameters). |
Total fracture surface area per well |
6.9×10⁶ m² |
Project Red: 2.787×10⁶ m² |
Greater fracture surface area expected than Project Red (Fercho et al., 2025). |
Reservoir Volume |
5,663,609,797 m³ |
Calculated from fracture area × fracture separation × number of fractures per well × number of wells |
|
Bottom-hole Temperature |
220.85℃ |
200–241℃; |
Fercho et al., 2024; Singh et al., 2025. Average reservoir temperature design point of the Fervo 3.0 well design used for Phase II (Fervo Energy, 2026g); Fervo also reports a 3.0 well reaching a 460℉ (238℃) resource (Fervo Energy, 2026a). |
Initial Production Temperature |
217℃ |
196–208℃ |
Approximate range of initial production temperatures between shallower and deeper producers (Singh et al., 2025). This range applies to the Phase I design; the case study base case is deeper (see Bench Design and Well Spacing). |
Average Production Temperature |
218℃ |
199–209℃ |
Approximate range of thermally conditioned production temperatures between shallower and deeper producers (Singh et al., 2025). This range applies to the Phase I design; the case study base case is deeper (see Bench Design and Well Spacing). |
Number of times redrilling |
2 |
2–5 |
Redrilling expected to be required within 5–10 years of project start. The case study’s redrilling events occur in years 13 and 26 of operations (see Production Temperature Profile section). |
Total wells drilled over project lifetime |
252 |
Permitted Limit: 320 |
The BLM Environmental Assessment (DOI-BLM-UT-C010-2024-0018-EA) authorizes an estimated development of 320 production and injection wells (BLM, 2024). As modeled, the 84 initial wells plus 2 redrilling campaigns of 84 wells each (years 13 and 26) total 252 wells, within this regulatory envelope. |
Production Temperature Profile¶
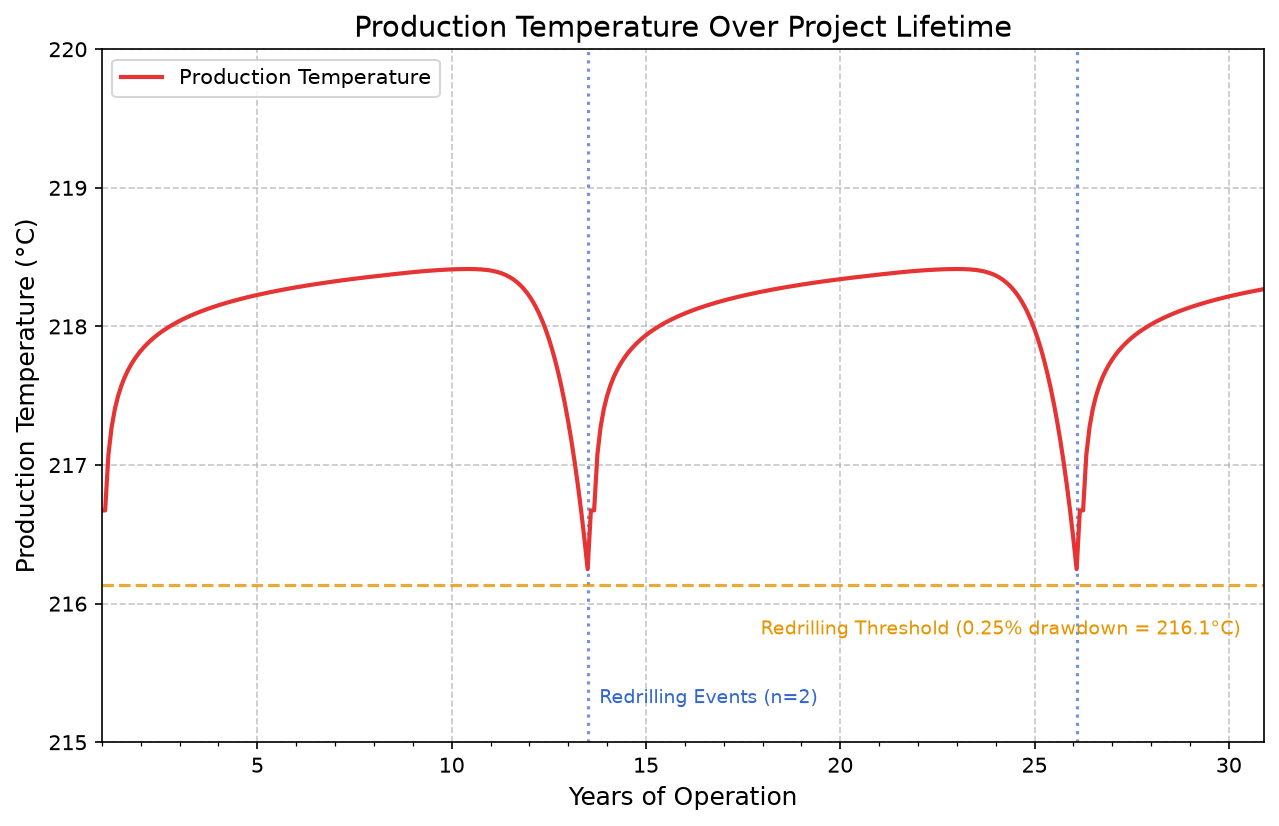
The production temperature profile exhibits distinctive cyclical behavior driven by the interaction between wellbore physics and reservoir thermal evolution:
Thermal Conditioning (Years 1–10): The initial rise in production temperature, from 216.7°C to a peak of approximately 218.4°C, is driven by the thermal conditioning of the production wellbores. As hot geofluid continuously flows through the wells, the wellbore casing and surrounding rock heat up, reducing conductive heat loss as predicted by the Ramey wellbore model.
Reservoir Drawdown (Years 11–13): Following the conditioning peak, temperature declines as the cold front from injection wells reaches the production zone (thermal breakthrough), reducing the produced fluid enthalpy. The larger fracture surface area per well of the 3.0 design delays breakthrough relative to the February 2026 Update, in which drawdown began in year 6.
Redrilling (Years 13 and 26): The model triggers a redrilling event when the next time step’s temperature would fall below the threshold defined by the
Maximum Drawdownparameter (shown as the dashed orange line). The production temperature does not necessarily actually reach the threshold; redrilling typically preemptively restores the wellfield before that occurs. The cost of these events is amortized as an operational expense over the project lifetime.
Power Generation Profile¶
Power generation is a direct function of production temperature, so the power production profile mirrors the thermal behavior described above. The graph shows both total (gross) electricity generation and net electricity generation after parasitic losses. The gap between the two curves represents the energy consumed by the circulation pumps.
The horizontal reference lines indicate the 500 MW net PPA minimum production requirement and the 660 MW nameplate capacity (combined capacity of the individual ORC units, 11×60 MWe).
Sensitivity Analysis¶
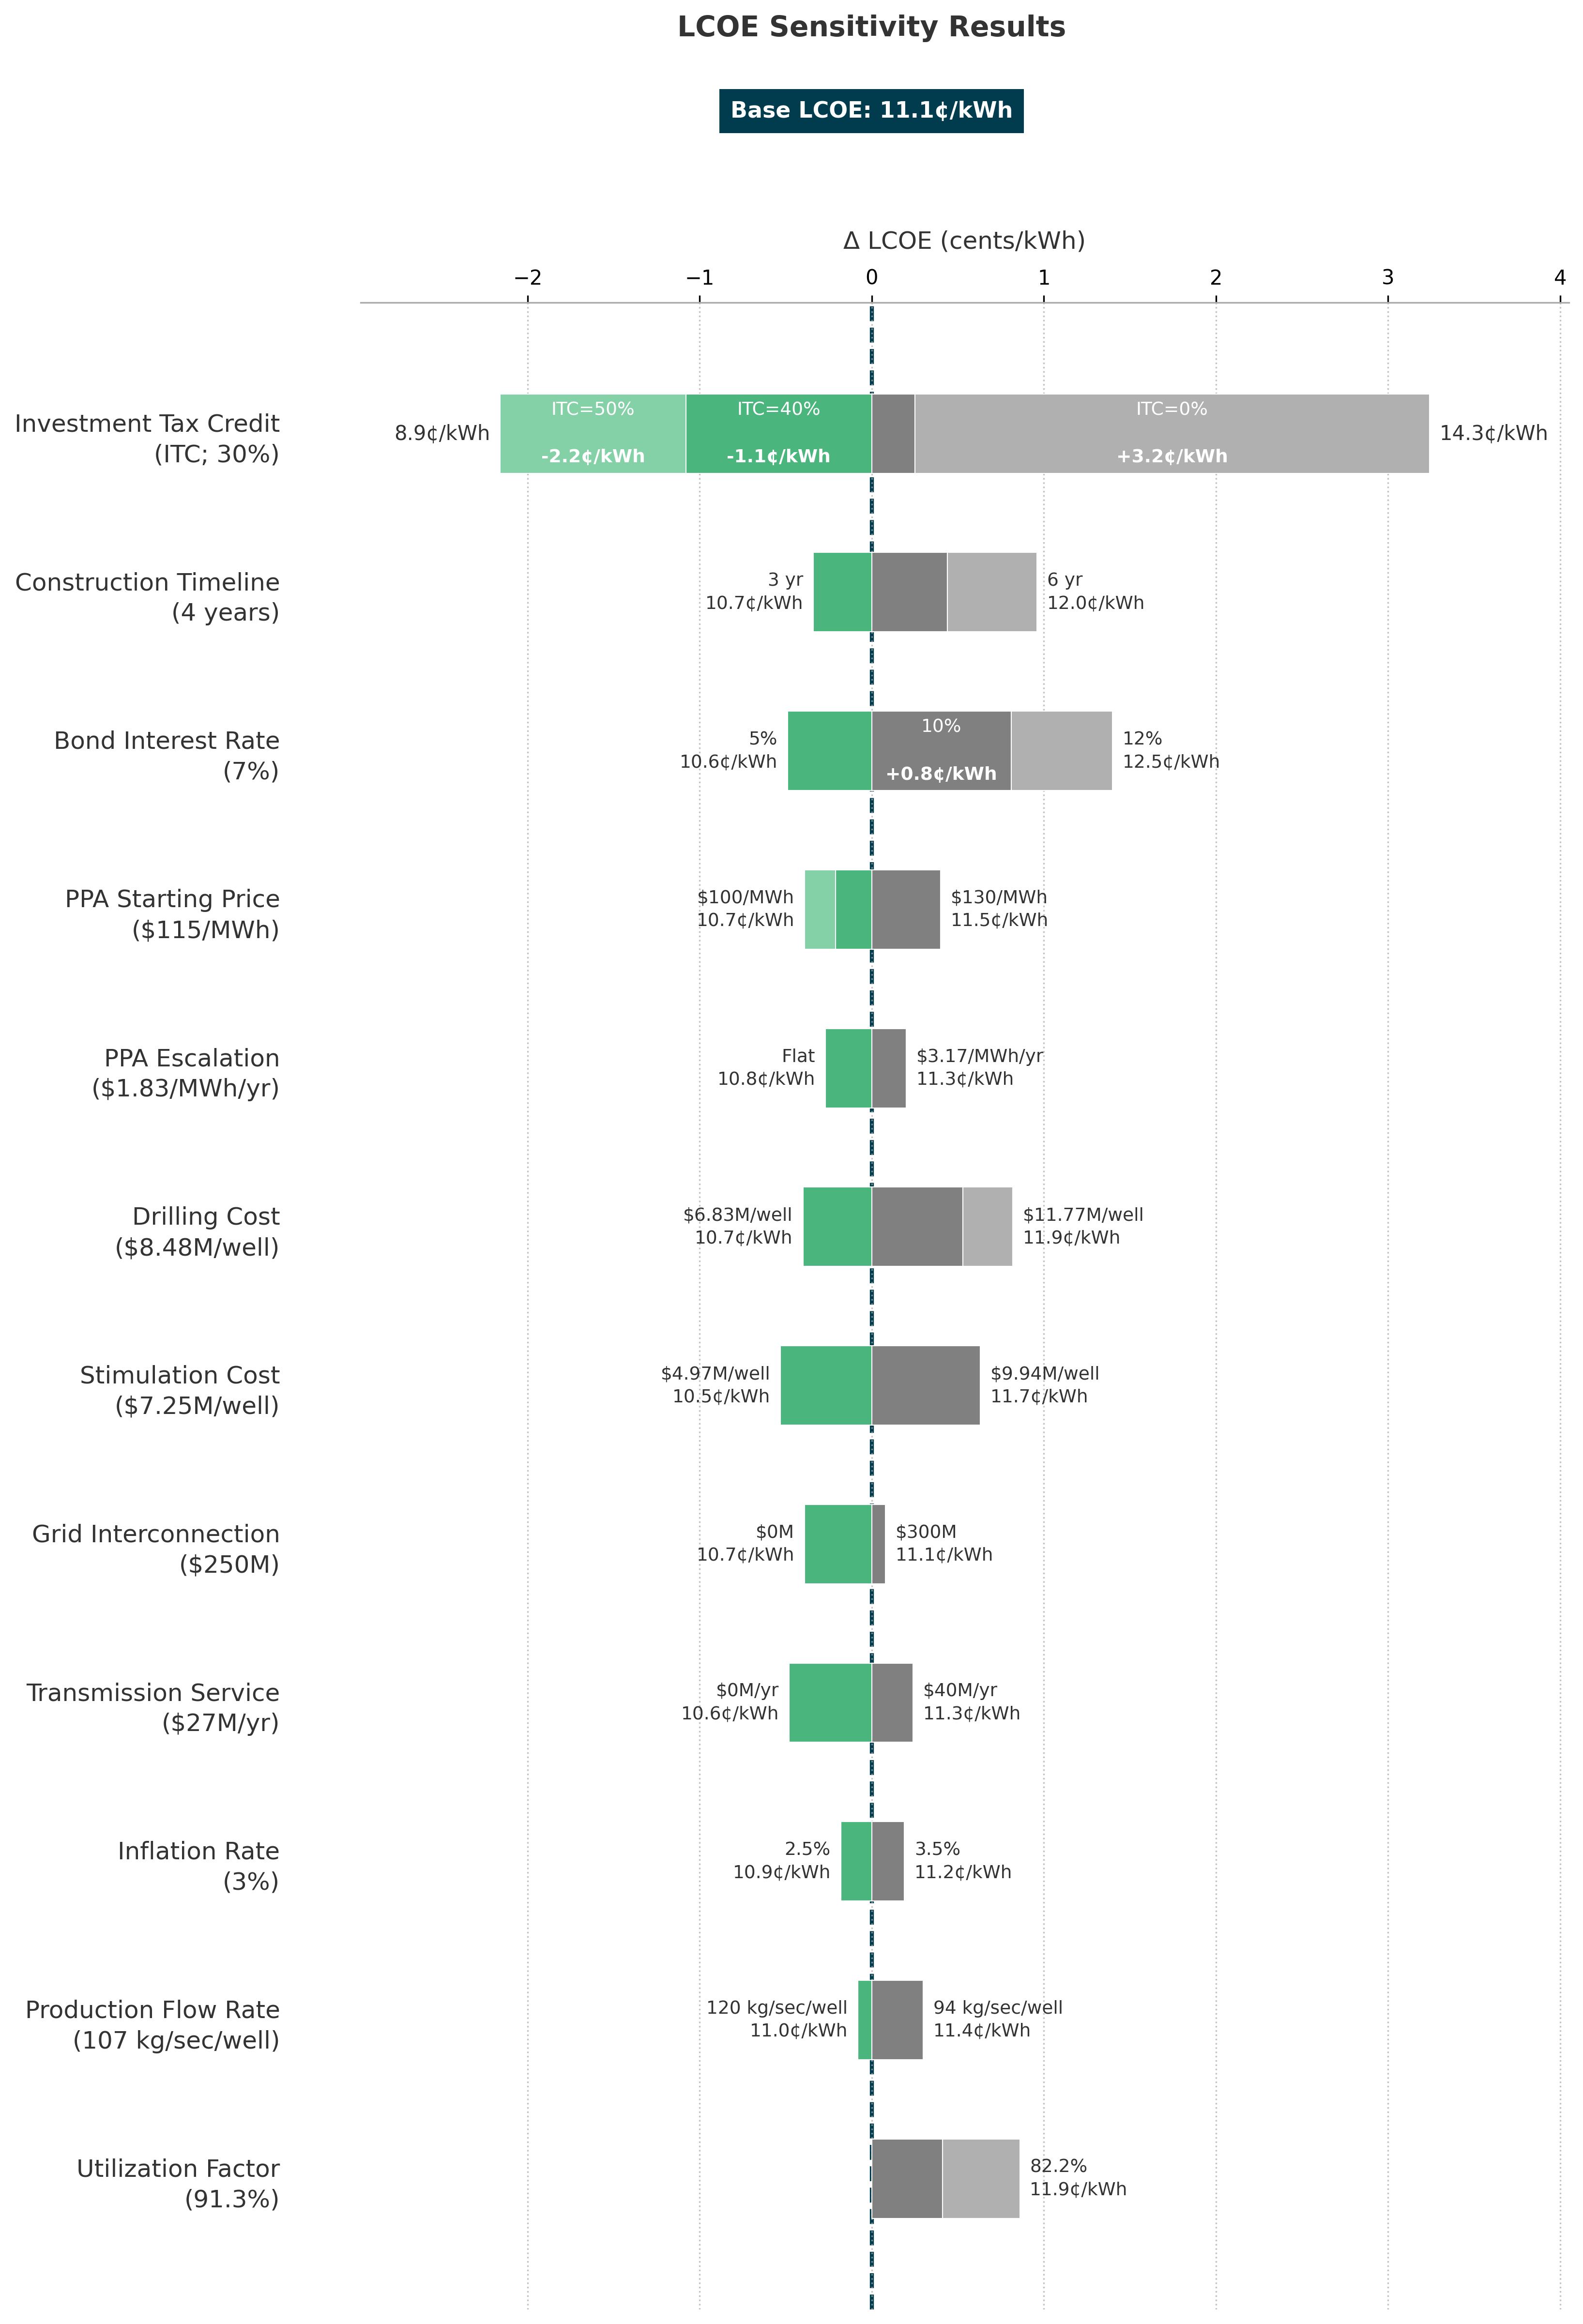
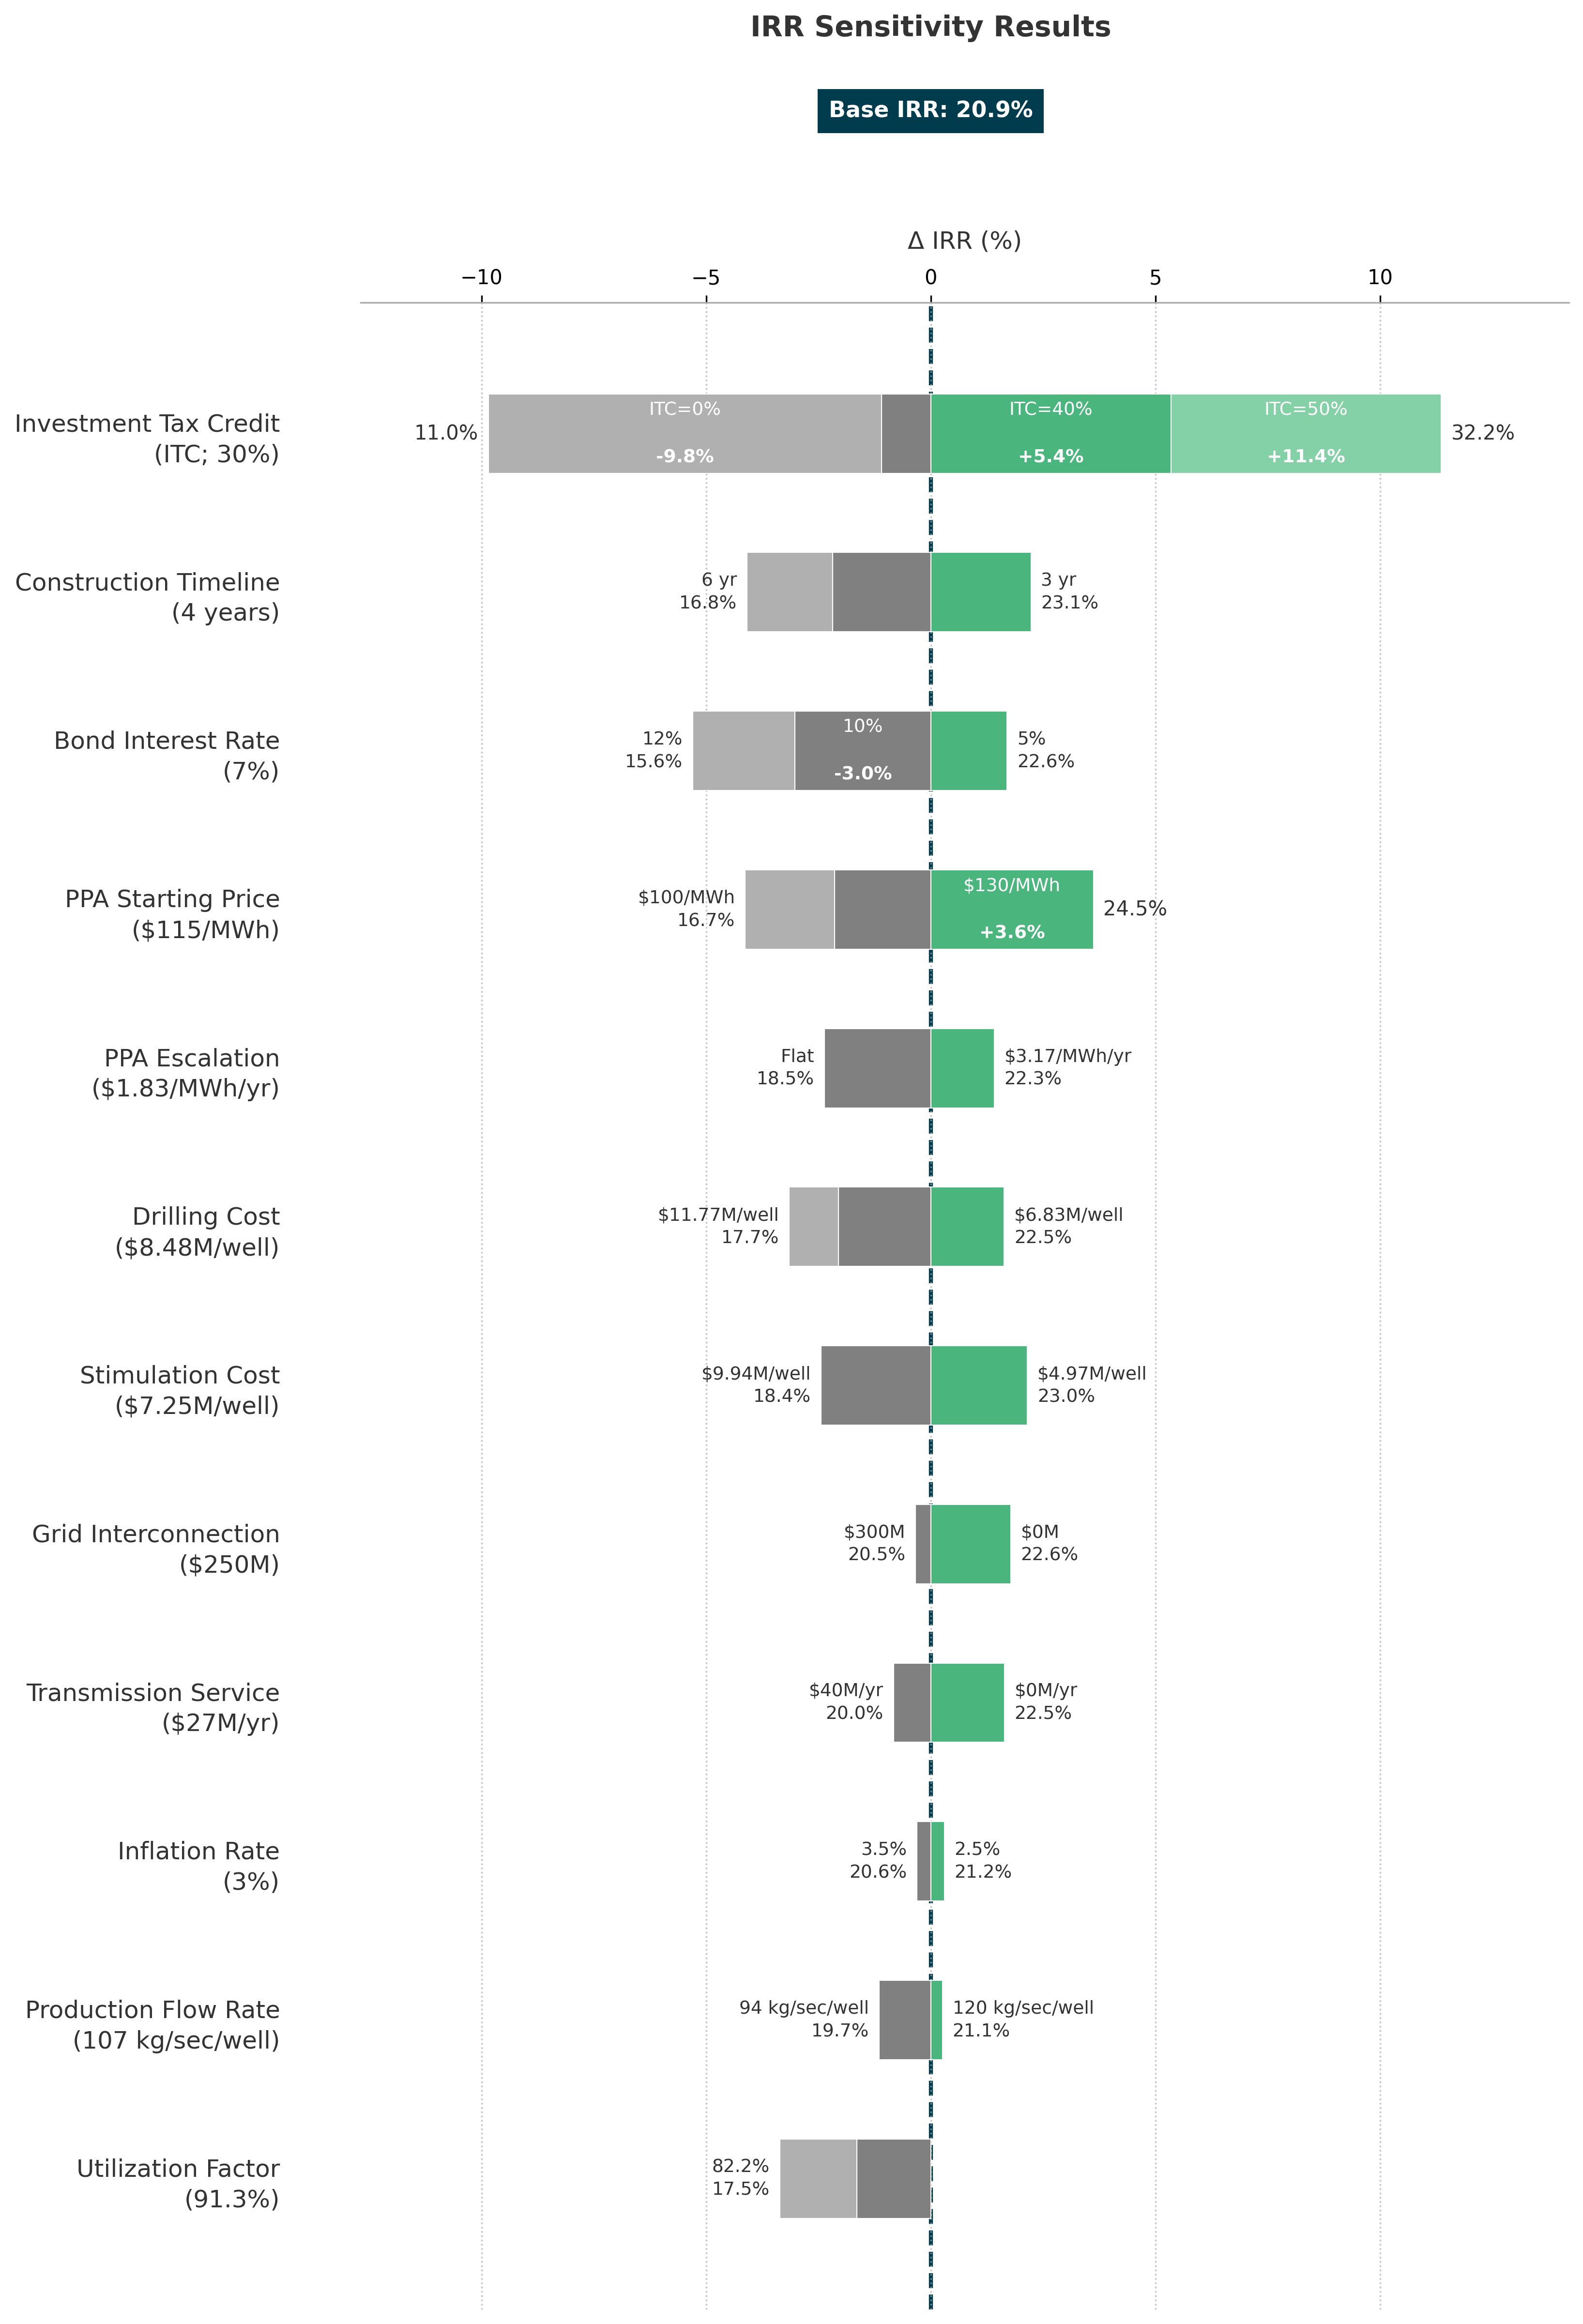
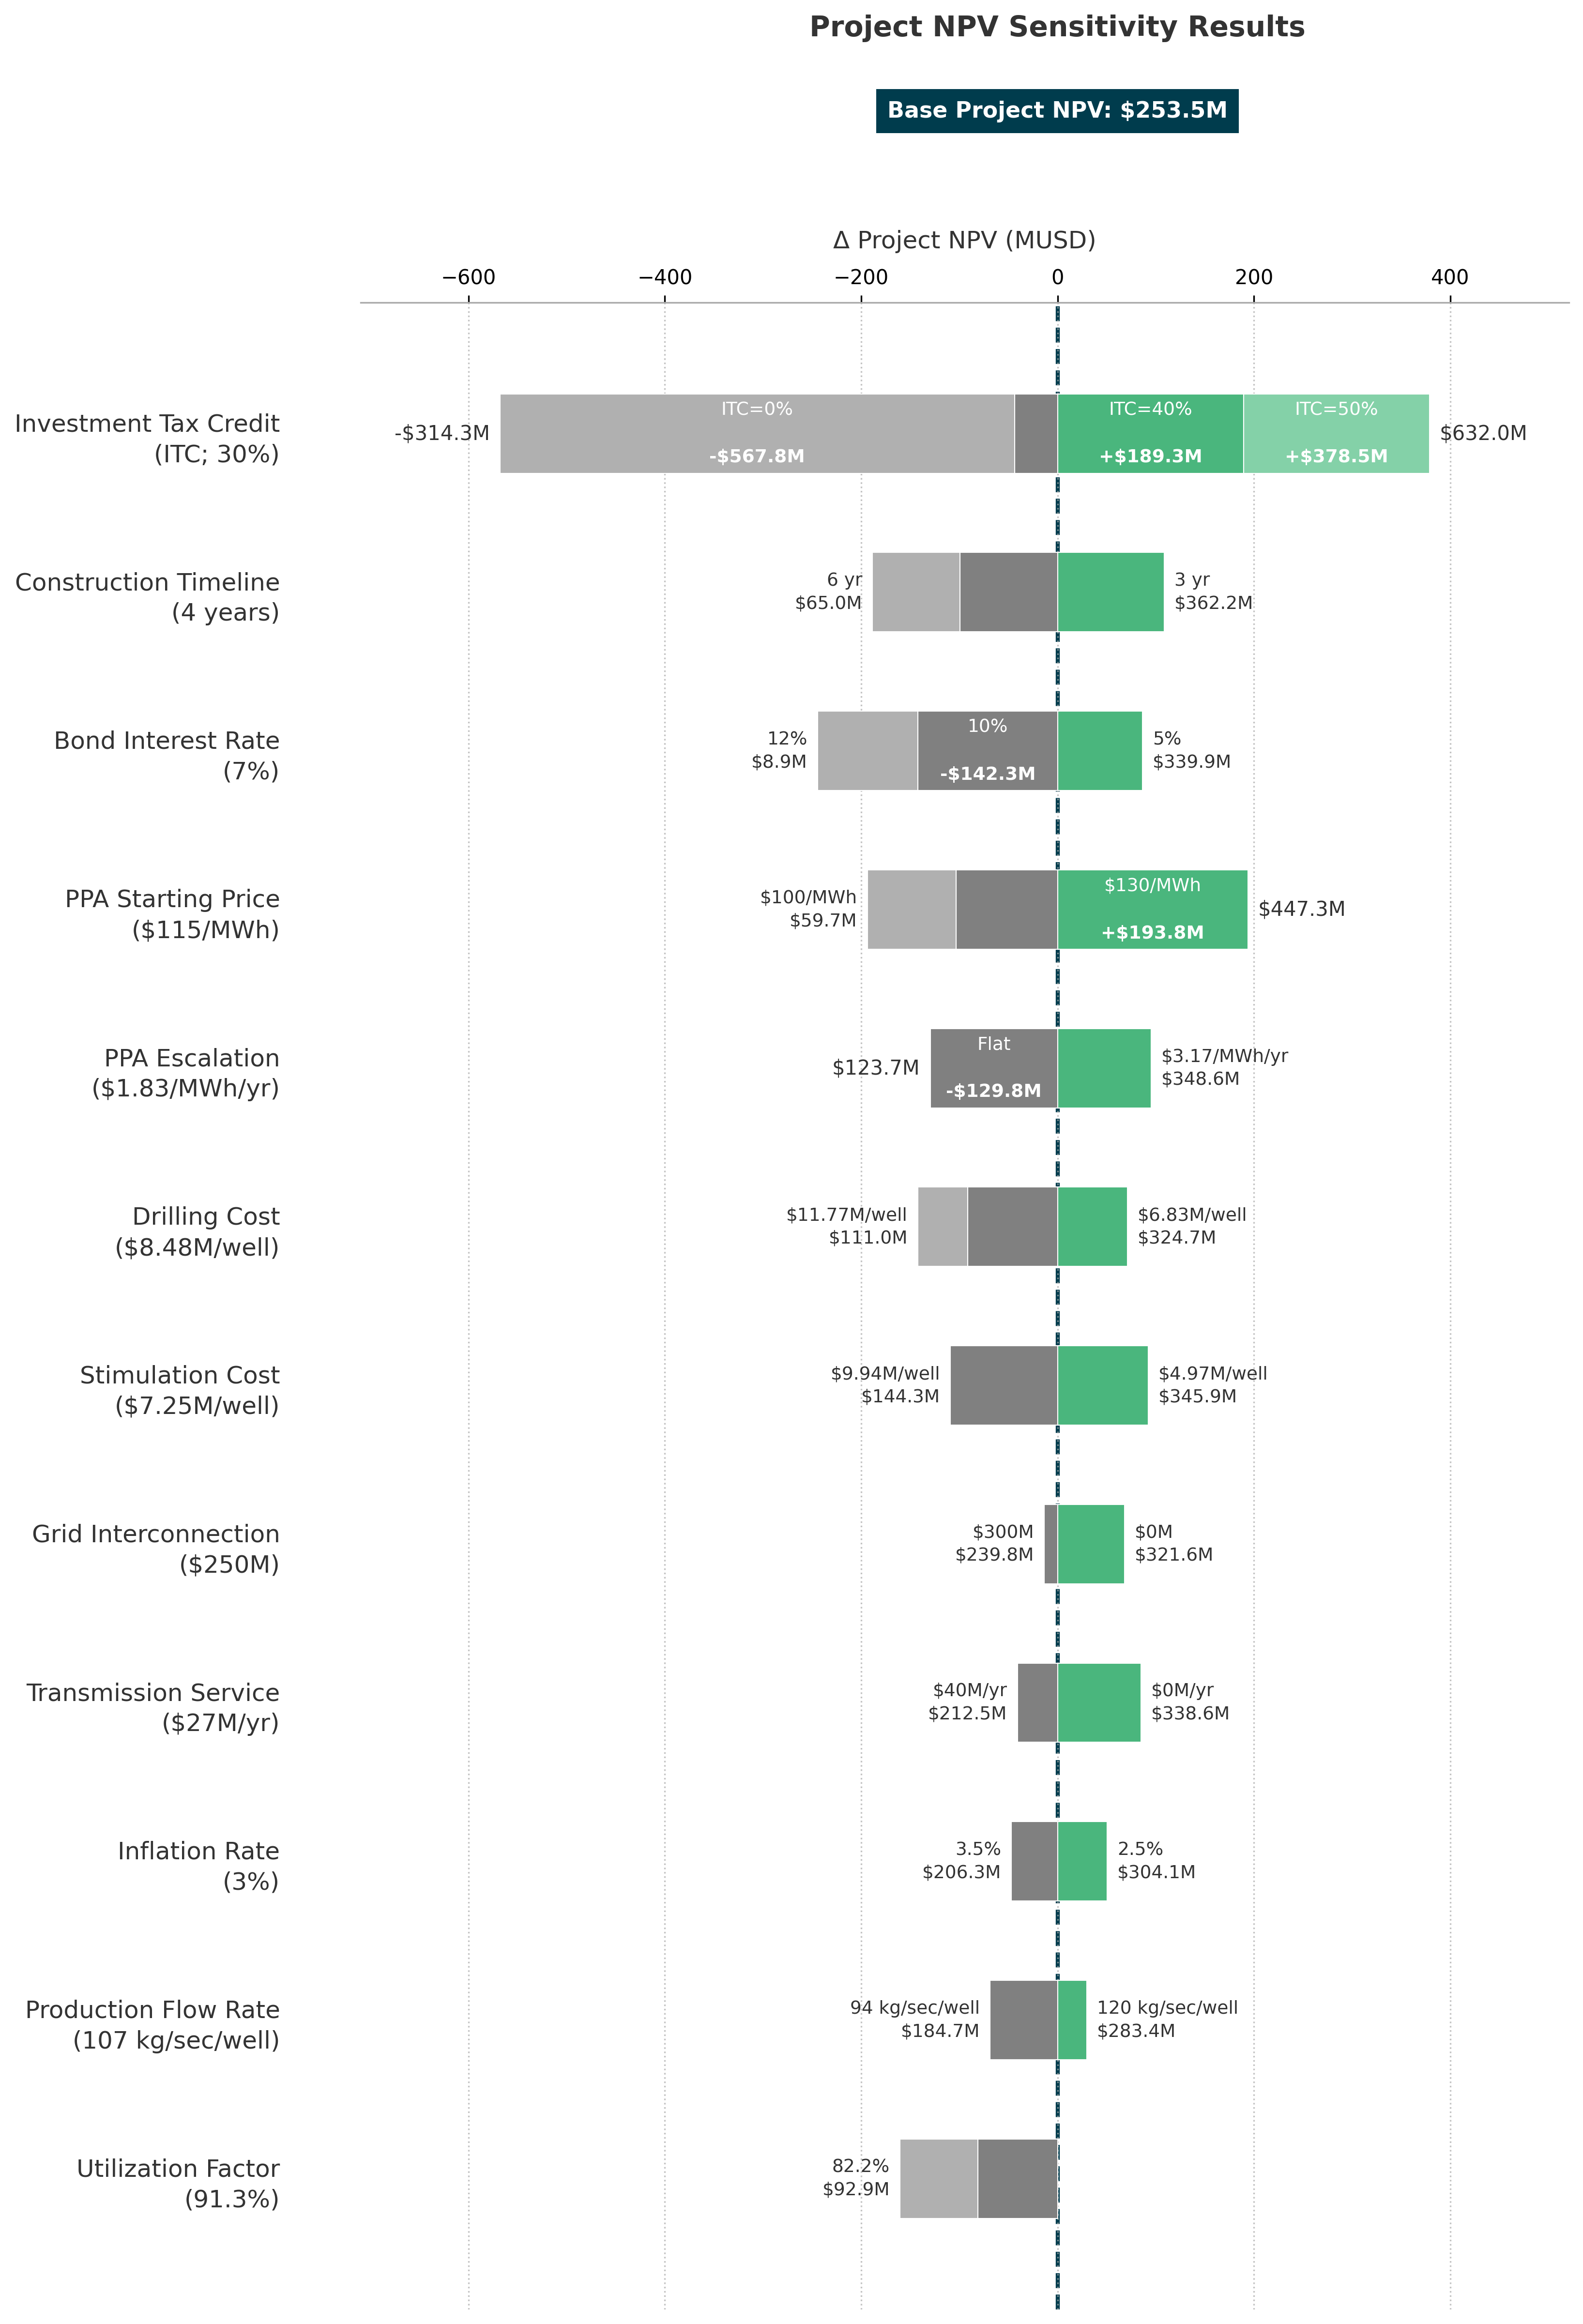
The following charts show the sensitivity of key metrics to various inputs. Each chart shows the sensitivity of a single metric, such as LCOE, to the set of tested input values. The leftmost chart column shows the parameter being tested and its baseline case study input value in parentheses. The bars for each row show the deltas of the metric value from the baseline case study value for the values tested for that parameter. Green bars indicate favorable outcomes, such as lower LCOE or higher IRR, while gray bars indicate unfavorable outcomes, such as higher LCOE or lower IRR. Click the bars to view the sensitivity analysis result for the input value in the web interface.
The parameter values tested below represent discrete sensitivity ranges intended to illustrate the magnitude of economic impact. They do not imply a specific statistical probability of occurrence. Future versions of this case study may incorporate formal uncertainty quantification to map the likelihood of these outcomes.
Some rows vary more than one input so that the row isolates the intended effect. The PPA Starting Price and PPA Escalation rows move the ending price (cap) so that the price is held flat after operating year 15, as in the base case. The Construction Timeline row holds the equity-only construction period at one year, as in the base case; otherwise a longer timeline would also shift more of the construction spending to equity. The ITC=27.7% case is the rate that removes the interconnection cost from the ITC basis (see Investment Tax Credit Basis in the Discussion section). The Utilization Factor row represents 5% and 10% curtailment as flat derates (see Curtailment in the Discussion section).
The sensitivity analysis scenarios do not necessarily conform to all constraints and assumptions documented in the case study methodology. For example, scenarios for Bond Interest Rate have different weighted average cost of capital (WACC) values due to the effect of interest rate on WACC. This is particularly relevant for technical parameters pertaining to reservoir engineering. In a real-world design, these variables are physically coupled; for instance, targeting a higher production flow rate would typically necessitate a larger fracture surface area to mitigate the resulting acceleration in thermal drawdown. See the discussion of flow rate below.
Users may wish to perform their own sensitivity analysis using GEOPHIRES’s Monte Carlo simulation module or other data analysis tools.
LCOE¶
Impact of PPA Price on LCOE¶
The sensitivity analysis reveals a positive correlation between the Power Purchase Agreement (PPA) price and the Levelized Cost of Electricity (LCOE). While counterintuitive, this is a function of SAM Economic Models treating federal and state income taxes as operating cash outflows.
In SAM Economic Models, the PPA price is a fixed input that determines project revenue. A higher PPA price generates higher taxable income, which in turn increases the project’s annual income tax liability (a negative cash flow). Because the LCOE calculation aggregates all lifetime project costs, including the tax burden, the additional tax costs incurred from higher revenues result in a higher calculated LCOE. Conversely, a lower PPA price reduces taxable income, lowers tax liability, and decreases the resulting LCOE.
IRR¶
NPV¶
Impact of Flow Rate on Project Economics¶
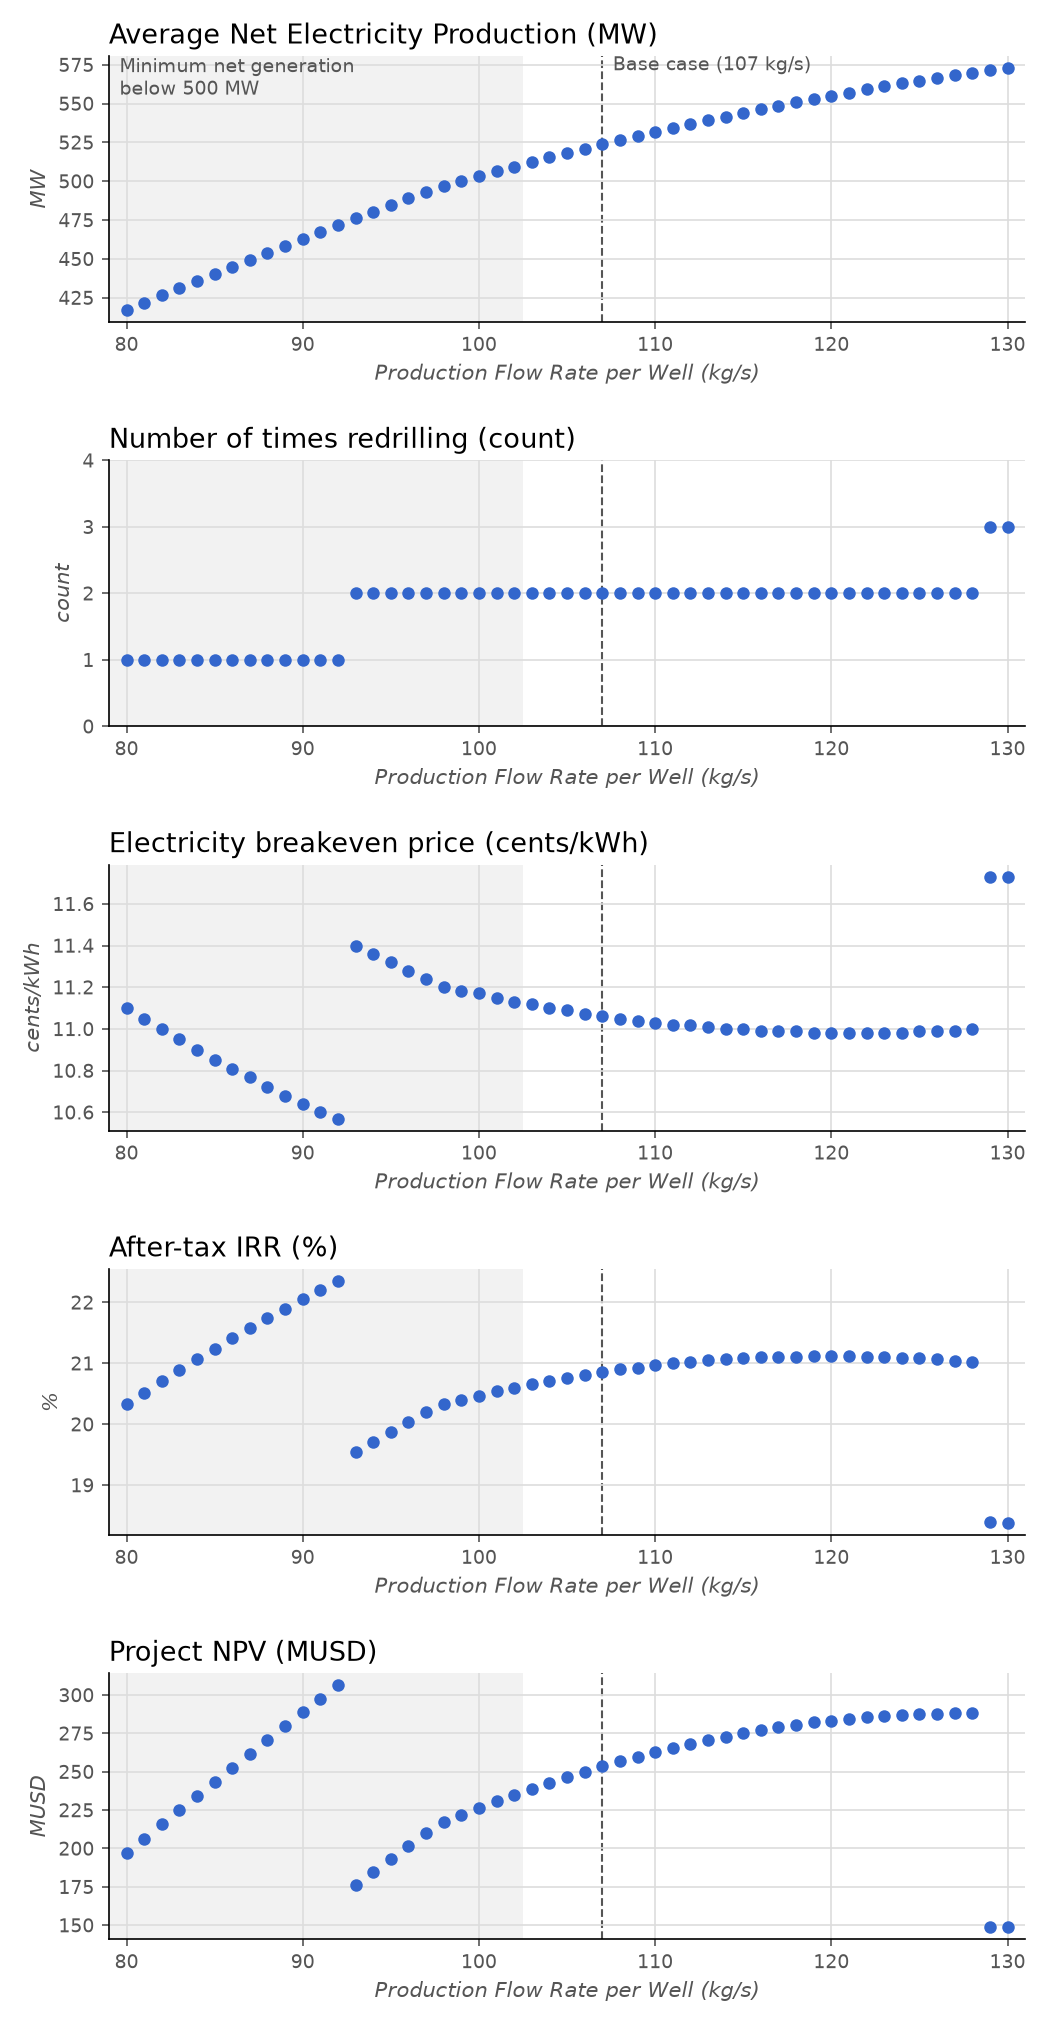
Higher flow rate per production well does not necessarily result in improved project economics (e.g. lower LCOE or higher IRR). Higher flow rates result in increased generation in the short term, but also cause faster thermal decline. Additional make-up wells may need to be drilled to compensate for increased thermal decline and maintain a minimum net generation (redrilling), the cost of which may offset incremental revenue from increased generation. This trade-off was considered in reservoir modeling that guided Fervo’s field implementation (Singh et al., 2025).
The parametric analysis below visualizes the trade-off within the context of the case study GEOPHIRES scenario,
revealing a sawtooth-shaped profile in the economic metrics (LCOE, IRR, NPV) despite the approximately linear increase in electricity production.
This pattern emerges because GEOPHIRES models capacity maintenance as discrete step functions
(shown in the Number of times redrilling chart) where exceeding the Maximum Drawdown threshold forces an entire new
redrilling campaign.
While real-world operators would likely mitigate these sharp transitions through continuous make-up drilling,
dynamic flow rate modulation, or other adaptive reservoir management strategies,
the model highlights a fundamental reality: the economic optimum is not necessarily the maximum achievable flow rate.
Instead, it is the rate that effectively balances immediate generation gains against the potential step-wise increase
in operational costs required to offset thermal decline.
See Redrilling Assumptions below for further discussion.
In the current version, the number of redrilling events steps from one to two between 92 and 93 kg/s per well and from two to three between 128 and 129 kg/s per well. Within the two-redrilling band, IRR varies by no more than 0.23 percentage points above the base case flow rate of 107 kg/s. Flow rates below 103 kg/s (shaded in the charts below) do not meet the 500 MWe minimum net generation requirement with 50 production wells, so the higher returns at flow rates with fewer redrilling events are not attainable under the case study’s PPA constraint without additional wells. The dashed line marks the base case flow rate.
Variants¶
100 MWe Model (Phase I)¶
The case study also includes a 100 MWe model, Fervo_Project_Cape-8, with equivalent capacity to Phase I.
Like the 500 MWe model, Fervo_Project_Cape-8 represents a SOAK project and not the real-world Phase I implementation
as built by Fervo. It is derived from Fervo_Project_Cape-7 by reducing the number of production wells, shortening
the construction period, scaling interconnection and transmission costs to 100 MWe, and resizing the debt fraction
to meet the same minimum DSCR target.
Click here to view the
100 MWe model in the GEOPHIRES web interface.
Source code: Fervo_Project_Cape-8.txt and Fervo_Project_Cape-8.out.
The February 2026 Update’s 100 MWe model, Fervo_Project_Cape-6, is documented in the
February 2026 Update of the case study.
Reduced Redrilling Scenario¶
This scenario increases Fracture Height by 20% (from
100 m to 120 m), which increases
fracture surface area per stimulated well by the same proportion and extends the thermal plateau.
Stimulation cost, which the case study parameterizes per unit fracture surface area, increases accordingly.
The number of redrilling events falls from two
(years 13 and 26 of operations) to one
(year 16), and minimum net generation remains above the
500 MWe PPA requirement.
Result |
Base Case |
Reduced Redrilling |
Change |
|---|---|---|---|
Fracture surface area per well (10⁶ m²) |
6.86 |
8.23 |
+1.37 (+20%) |
Redrilling events |
2 |
1 |
-1 (-50%) |
Total wells over project lifetime |
252 |
168 |
-84 (-33%) |
Stimulation ($M) |
609.1 |
730.9 |
+121.8 (+20%) |
Total CAPEX ($M) |
3,712.7 |
3,853.8 |
+141.1 (+4%) |
Redrilling ($M/yr) |
76.9 |
43.3 |
-33.6 (-44%) |
Minimum net generation (MW) |
511.3 |
511.4 |
+0.2 |
LCOE ($/MWh) |
109.2 |
105.0 |
-4.2 (-4%) |
After-tax IRR (%) |
21.5 |
22.7 |
+1.2 pts |
Project NPV ($M) |
278.7 |
351.9 |
+73.2 (+26%) |
GEOPHIRES amortizes the cost of all redrilling events uniformly over the project lifetime (see Redrilling Assumptions in the Discussion section), so each avoided event reduces operating costs from the first year of operations. This overstates the value of avoiding a late redrilling event compared with incurring its cost in the year it occurs.
Click here to open the
base case in the GEOPHIRES web interface, and set Fracture Height to 120 to
reproduce this scenario.
Previous Versions¶
Documentation is available for the following previous case study versions, which are deprecated in favor of this version.
Fervo_Project_Cape-5 (February 2026 Update)¶
Source code: Fervo_Project_Cape-5.txt and Fervo_Project_Cape-5.out
Last Updated: 2026-07-03
Key differences in the October 2026 Update:
Subsurface design aligned with the Fervo 3.0 well design: 3.06 km reservoir depth (221℃ / 430℉), 7,500 ft cased laterals, 8⅝ inch casing, and 225 fractures per well
Lateral drilling cost modeled explicitly (
Well Geometry Configuration,Number of Multilateral Sections per Vertical Section,Multilaterals Cased,All-in Nonvertical Drilling Costs), with the drilling cost adjustment factor recalibrated to 0.72 against Fervo’s disclosed Phase I well costsStimulation cost parameterized per unit fracture surface area
Parasitic load calibrated to 20% or more of net generation (Productivity Index and Injectivity Index derated)
Wellfield re-sized to 50 production wells and 34 injection wells; nameplate capacity of 11 Gen 2 ORC units
Grid interconnection ($250M) and firm transmission service ($27M/yr) added
PPA starting price of $115/MWh with a 1.5%-equivalent escalator from the second operating year, capped at the year 15 price
Construction period of 4 years; inflation rate of 3.0%; exploration cost re-derived from the current well cost
ResFrac Profile + Hotter/Deeper Scenariovariant removed. It applied the Singh et al. (2025) temperature profile for the Phase I design to the February 2026 Update’s 100 MWe inputs at a 3 km depth; the base case now uses the deeper 3.0 design, to which that profile does not applyReduced Redrilling Scenario rebuilt on current inputs (greater fracture height) and generated with the documentation instead of linked as a shared result
The following tables list every input parameter whose value differs between the February 2026 Update and the October 2026 Update, with the rationale for each change, and compare key results. See the input files for the full parameter comments and citations.
Parameter |
February 2026 Update |
October 2026 Update |
Rationale |
|---|---|---|---|
Inflation Rate |
2.7% |
3% |
Updated for 2026 inflation: US CPI-U was 3.4% year over year in August 2026, with core at 2.4% (BLS, 2026b). The February 2026 Update used December 2025 inflation. |
Starting Electricity Sale Price |
$95/MWh |
$115/MWh |
Midpoint of the $100–130/MWh range Fervo reports for contracts under negotiation (Fervo Energy, 2026f), replacing 2024b ATB Geysers–Sacramento pricing. |
Electricity Escalation Rate Per Year |
$0.57/MWh |
$1.83/MWh |
Linear equivalent of a 1.5% per year compounding escalator on the new starting price (CTVC, 2025), replacing an escalator calibrated to reach $100/MWh in project year 11. |
Ending Electricity Sale Price |
$1000/MWh |
$140.6/MWh |
Caps escalation at the operating year 15 price, holding the price flat after a 15-year PPA term. The February 2026 Update had no effective cap. |
Electricity Escalation Start Year |
1 yr |
0 yr |
First escalation step in the second operating year, matching a PPA that escalates from the first anniversary of commercial operation. |
Fraction of Investment in Bonds |
70% |
62% |
Resized for a minimum pre-tax DSCR of at least 1.35, the 2024b ATB geothermal value (NREL, 2025), at the 18-year Debt Tenor; at 0.7, the minimum DSCR would be 1.21. |
Debt Tenor |
Not set |
18 yr |
New input in GEOPHIRES 3.18; the February 2026 Update repaid debt over the 30-year plant lifetime. 18 years is the 2024b ATB debt amortization assumption (NREL, 2025) and the SAM default, 3 years beyond the 15-year PPA term. |
Construction Years |
5 yr |
4 yr |
A SOAK developer is modeled with one fewer year than the 5-year FOAK timeline, informed by Fervo’s Phase I build pace and rig capacity (Fervo Energy, 2026e; 2026f; 2026j). |
Construction CAPEX Schedule |
0.014, 0.027, 0.139, 0.431, 0.389 |
0.041, 0.139, 0.431, 0.389 |
The first two years of the 5-year DOE-ATB hybrid schedule are merged to match the 4-year construction period. |
Depreciation Schedule |
Not set |
5-year MACRS |
New input. 5-year MACRS is the statutory class for facilities that claim the technology-neutral clean electricity credits (IRC sections 48E and 45Y), replacing the 20-year straight-line schedule of the SAM template. Assumes the owner can use the early-year tax losses, for example through a tax equity partner. |
Exploration Capital Cost |
$30M |
$56M |
Re-derived from the 2024b ATB exploration assumption of 5 full-size wells at the new per-well drilling cost. |
Well Drilling and Completion Capital Cost Adjustment Factor |
90% |
72% |
Geometric mean of the ATB-aligned baseline (0.9) and Fervo’s best demonstrated Phase I well (0.58), now applied to both the vertical section and the lateral. The February 2026 Update applied 0.9 to the vertical section only. |
All-in Nonvertical Drilling Costs |
Not set |
$2360/m |
Per-meter lateral cost from the 2025 NREL drilling cost curve at 3.06 km (Akindipe and Witter, 2025), so the lateral is costed explicitly. |
Multilaterals Cased |
Not set |
True |
Fervo’s laterals are cased and cemented for plug-and-perf stimulation (Norbeck et al., 2024). |
Reservoir Stimulation Capital Cost per Fracture Surface Area |
Not set |
$0.875/m² |
Stimulation is priced per unit fracture area so that cost tracks fracture count and geometry; equivalent to the February 2026 Update’s $4M per 150-fracture well. |
Reservoir Stimulation Capital Cost per Production Well |
$4M |
Stimulated (cost from per-area input) |
Production wells are stimulated and costed from the per-area input. |
Reservoir Stimulation Capital Cost per Injection Well |
$4M |
Not set |
Replaced by the per-area input. |
One-time Flat License Fees Etc |
Not set |
$250M |
Grid interconnection cost of $500/kW for 500 MWe, based on PacifiCorp cluster-study estimates for geothermal requests in Beaver and Millard Counties (Seel et al., 2026). Not included in the February 2026 Update. |
Annual License Fees Etc |
Not set |
$27M/yr |
Long-term firm point-to-point transmission service for 500 MW at PacifiCorp’s June 2025 OATT formula rate (Rocky Mountain Power, 2026) plus Schedule 1 (PacifiCorp, 2017). Not included in the February 2026 Update. |
Reservoir Depth |
2.68 km |
3.06 km |
Depth at which the reservoir reaches about 221℃ (430℉), the Fervo 3.0 design point for Phase II (Fervo Energy, 2026f; 2026g). 2.68 km corresponded to the roughly 400℉ Phase I design. |
Number of Fractures per Stimulated Well |
150 |
225 |
18 stages for the 7,500 ft 3.0 lateral instead of 12 for a 5,000 ft lateral, at the same stage length. |
Number of Production Wells |
56 |
50 |
Re-sized for the 3.0 design to meet the 500 MWe PPA minimum within the nameplate capacity of 11 Gen 2 ORC units, with about 27% more power per well at 430℉ (Fervo Energy, 2026f). |
Well Geometry Configuration |
Not set |
L |
L configuration (vertical section plus one lateral), required to cost the lateral explicitly. |
Number of Multilateral Sections per Vertical Section |
Not set |
1 |
One lateral per well, costed explicitly instead of folded into the vertical well cost. |
Number of Multilateral Sections |
0 |
Not set |
Replaced by Number of Multilateral Sections per Vertical Section. |
Nonvertical Length per Multilateral Section |
5000 feet |
7500 feet |
Lateral length of the Fervo 3.0 design (Fervo Energy, 2026f; 2026g), up from the 5,000 ft Phase I laterals. |
Production Well Diameter |
8.535 in |
7.825 in |
Inner diameter of the 8⅝ inch casing Fervo disclosed for the 3.0 design (Fervo Energy, 2026f; 2026g), replacing the inferred 9⅝ inch casing. |
Injection Well Diameter |
8.535 in |
7.825 in |
Same as production wells. |
Injectivity Index |
1.38 kg/sec/bar |
1.20 kg/sec/bar |
Derated to yield a parasitic load of at least 20% of net generation, between the 15–20% goal and the 25–35% observed in Phase I operations (Norbeck, 2026). |
Productivity Index |
1.13 kg/sec/bar |
0.98 kg/sec/bar |
Derated in proportion with the Injectivity Index. |
Redrilling Learning Rate |
Not set |
10% |
|
Salvage Value Rate |
50% |
Not set |
Updated GEOPHIRES default salvage value rate. |
Result |
February 2026 Update |
October 2026 Update |
Change |
|---|---|---|---|
LCOE ($/MWh) |
85.0 |
109.2 |
+24.2 (+28%) |
Levelized PPA price ($/MWh) |
98.0 |
125.1 |
+27.1 (+28%) |
After-tax IRR (%) |
22.4 |
21.5 |
-0.9 pts |
Project NPV ($M) |
199.1 |
278.7 |
+79.6 (+40%) |
Levered equity profitability index |
1.33 |
1.26 |
-0.07 (-5%) |
WACC (%) |
8.31 |
9.17 |
+0.86 pts |
Investment Tax Credit ($M) |
859.7 |
1,113.8 |
+254.1 (+30%) |
Total CAPEX ($M) |
2,865.8 |
3,712.7 |
+847.0 (+30%) |
Total CAPEX ($/kW) |
5,595 |
7,059 |
+1,464 (+26%) |
Overnight capital cost ($M) |
2,437.2 |
3,230.3 |
+793.1 (+33%) |
Exploration ($M) |
30.0 |
56.0 |
+26.0 (+87%) |
Well drilling and completion ($M) |
437.0 |
712.0 |
+275.0 (+63%) |
Well drilling and completion per well ($M) |
4.65 |
8.48 |
+3.83 (+82%) |
Stimulation ($M) |
454.0 |
609.1 |
+155.1 (+34%) |
Stimulation per well ($M) |
4.83 |
7.25 |
+2.42 (+50%) |
Surface power plant ($M) |
1,467.8 |
1,553.0 |
+85.2 (+6%) |
Field gathering system ($M) |
48.3 |
50.2 |
+1.9 (+4%) |
Grid interconnection ($M) |
0.0 |
250.0 |
+250.0 |
Total O&M ($M/yr) |
135.3 |
158.2 |
+22.8 (+17%) |
Redrilling ($M/yr) |
89.1 |
76.9 |
-12.2 (-14%) |
Transmission service ($M/yr) |
0.0 |
27.0 |
+27.0 |
Production wells |
56 |
50 |
-6 (-11%) |
Injection wells |
38 |
34 |
-4 (-11%) |
Redrilling events |
3 |
2 |
-1 (-33%) |
Total wells over project lifetime |
376 |
252 |
-124 (-33%) |
Minimum net generation (MW) |
499.1 |
511.3 |
+12.2 (+2%) |
Average net generation (MW) |
510.2 |
523.7 |
+13.5 (+3%) |
Maximum net generation (MW) |
512.2 |
526.0 |
+13.8 (+3%) |
Maximum total generation (MW) |
599.8 |
634.6 |
+34.8 (+6%) |
Average annual net generation (GWh) |
4,080 |
4,189 |
+108 (+3%) |
Initial pumping power / net installed power (%) |
17.5 |
21.1 |
+3.7 pts |
Average pumping power / average total generation (%) |
14.7 |
17.2 |
+2.5 pts |
Heat to power conversion efficiency (%) |
13.9 |
14.5 |
+0.6 pts |
Bottom-hole temperature (℃) |
205.4 |
220.8 |
+15.5 (+8%) |
Initial production temperature (℃) |
201.9 |
216.7 |
+14.8 (+7%) |
Average production temperature (℃) |
203.0 |
218.1 |
+15.1 (+7%) |
Fracture surface area per well (10⁶ m²) |
4.58 |
6.86 |
+2.29 (+50%) |
LCOE changes with the PPA price as well as with costs (see Impact of PPA Price on LCOE). With the February 2026 Update’s PPA terms and all other October 2026 Update inputs, LCOE is $102.0/MWh rather than $109.2/MWh; that difference reflects the PPA price change rather than cost changes.
Fervo_Project_Cape-4¶
Last Updated: 2025-08-11
Key differences:
Fervo_Project_Cape-5 models multiple construction years instead of a single construction year
Fervo_Project_Cape-5 incorporates various reservoir characteristic and engineering updates including:
Segmented geology (gradients)
Ambient and surface temperature refinement
5-well bench design instead of well pairs (doublets)
8.5-inch inner well diameter
Productivity/Injectivity indexes instead of impedance model
Stimulation parameters and outcome
Fervo_Project_Cape-5 incorporates various reservoir and economic parameter updates including:
BLM royalties
Refined discount and interest rates
Refined tax rates including addition of property tax
Fervo_Project_Cape-5 includes more comprehensive sensitivity analysis
Discussion, Limitations, & Future Work¶
While this case study establishes a validated economic baseline for Second-of-a-Kind (SOAK) EGS using standardized consensus data, users should interpret results (LCOE, IRR, NPV, etc.) as an assessment of intrinsic project viability rather than a fully burdened commercial pro-forma. Several financial, technical, and operational factors were not explicitly modeled and represent areas for future refinement.
Users may wish to explicitly encode these cost factors in their own models by using applicable adjustment parameters.
For OPEX, such parameters may include Wellfield O&M Cost Adjustment Factor,
Surface Plant O&M Cost Adjustment Factor or Total O&M Cost. For CAPEX, One-time Flat License Fees Etc or
Total Capital Cost may be appropriate.
Note that the case study itself uses One-time Flat License Fees Etc for grid interconnection cost and
Annual License Fees Etc for transmission service cost, so additional costs entered via these parameters should be
added to the case study values.
Financial Considerations¶
The case study economic results focus on project-level cash flows but do not explicitly itemize several overhead costs and administrative realities often associated with commercial project financing. Including these may reduce the levered IRR.
Transaction & Closing Fees: The Total CAPEX includes interest during construction but does not explicitly budget for debt closing or bank fees. In large-scale energy infrastructure, these transaction costs may constitute a small percent of total debt volume. Click here to view the relevant GEOPHIRES tracking issue on GitHub.
Reserve Accounts: The cash flow analysis assumes immediate liquidity. It does not model working capital, debt service, or major equipment replacement reserve accounts. Project financial partners may require that the project owner(s) establish and fund reserve accounts. Click here to view the relevant GEOPHIRES tracking issue on GitHub.
Insurance Premiums: The model does not include a specific line item for insurance. For EGS projects involving deep subsurface risks, insurance premiums could represent an additional annual operating expense. Click here to view the relevant GEOPHIRES tracking issue on GitHub.
Investment Tax Credit Basis: GEOPHIRES’s SAM Single Owner PPA model applies the ITC rate to total installed cost, which includes the grid interconnection cost. Qualified interconnection property is only eligible for the ITC for energy property of 5 MW or less (IRC §48(a)(8)), so the model overstates the credit by approximately $86M (30% of the $287M interconnection cost including its share of inflation and interest during construction). The case study retains the statutory 30% rate because the same line item carries an unmodeled benefit in the other direction: in non-ISO balancing authorities such as PacifiCorp, network upgrade costs, the majority of interconnection cost, are often refunded to the interconnection customer over up to 20 years with interest once the plant reaches commercial operation (Seel et al., 2026). An ITC rate of 27.68% applied to total installed cost removes the overstatement and reduces the after-tax IRR by approximately 1.1 percentage points. A parameter that excludes a specified amount from the ITC basis, or an ITC amount input, would allow both effects to be modeled explicitly.
Debt Term: The case study repays debt in level annual payments over 18 years from commercial operation (see Debt Tenor), beyond the 15-year PPA term, so debt service in the final 3 years of the loan depends on the post-PPA price. The minimum pre-tax debt service coverage ratio (DSCR) is 1.41, in operating year 1. A loan term no longer than the PPA term would increase annual debt service, reducing the DSCR and, at the same debt fraction, the levered IRR.
Salvage Value and Decommissioning: The SAM Single Owner PPA model credits a salvage value of 10% of total CAPEX ($371M) as revenue in the final project year. Well plugging and abandonment and other decommissioning costs are not modeled.
Technical & Operational Considerations¶
Grid Interconnection & Transmission: The case study includes $250M of network resource interconnection cost in CAPEX (entered as
One-time Flat License Fees Etc) and $27M/yr of long-term firm point-to-point transmission service in OPEX (entered asAnnual License Fees Etc); see the Economic Parameters table for derivations. Not modeled: refunds of network upgrade costs to the interconnection customer after commercial operation (see Investment Tax Credit Basis above); a second firm transmission reservation that would be required to deliver across an intervening system to a CAISO offtaker, which could roughly double the transmission cost; transmission losses; and escalation of the transmission rate, which GEOPHIRES holds flat in nominal terms.Curtailment: Curtailment is not modeled. The
Utilization Factorinput represents plant availability, and the GEOPHIRES SAM Economic Model integration does not currently support grid-limit or curtailment inputs. The case study assumes network resource interconnection service sufficient for full output. As an illustration, reducing theUtilization Factorby 5% and 10% (to 0.867 and 0.822) as a flat proxy for curtailment reduces the after-tax IRR by approximately 1.6 and 3.3 percentage points, respectively. A per-year utilization factor schedule would also allow a first-year commissioning ramp to be modeled, such as the ramp-up Fervo reports for the first Phase I GeoBlock as it brings the full well system online after first power (Fervo Energy, 2026e).Nominal O&M Costs: GEOPHIRES holds fixed O&M costs, including the transmission service cost, flat in nominal terms. At the case study’s 3.0% inflation rate, this represents a declining real cost over the 30-year project lifetime, which is optimistic.
Seasonal and Hourly Performance Granularity: As noted in the Surface Plant Parameters, this study uses a fixed annual average ambient temperature. It does not model the seasonal or hourly impacts on air-cooled condenser efficiency. In reality, power output would likely dip during peak summer hours and increase during winter. Future versions of GEOPHIRES may add support for these considerations; click here to view the relevant GEOPHIRES tracking issue on GitHub.
Redrilling Assumptions: Management of thermal decline is modeled as periodic redrilling events that reset the reservoir’s heat content to initial conditions at intervals determined by the
Maximum Drawdownparameter. The cost of these events is amortized into a uniform annual operating expense. In reality, these events may be scheduled as discrete capital-intensive campaigns punctuated by years of lower spending, or as a continuous program of make-up well drilling to mitigate decline. Fervo describes its approach as a makeup-well drilling program in which later wells benefit from cumulative learnings (Fervo Energy, 2026f). Click here to view the relevant GEOPHIRES tracking issue on GitHub. Note that the reservoir heat content and percentage of total heat mined in the annual profile of the result file are cumulative against the initial reservoir and are not reset by redrilling, so the heat content is negative from operating year 20 and 151.8% of the initial heat content is mined by the final year. These values reflect that accounting rather than physical depletion: redrilled wells access rock that the initial reservoir heat content does not include.Reservoir Modeling Fidelity: The base case utilizes the Gringarten analytical model, which produces a characteristic thermal plateau maintained until a sharp breakthrough event. A key open question is whether this idealized profile provides an acceptably accurate approximation of drawdown over time, or if it masks the gradual dispersion caused by flow channeling and heterogeneity. The Project Red case study compares the GEOPHIRES Gringarten model against the first two years of measured production temperatures from Fervo’s Project Red and finds close alignment when the active fracture count is de-rated for heterogeneous flow; that record does not yet extend to the long-term decline that determines redrilling timing. Future work should evaluate whether Gringarten remains the optimal scoping proxy, or if an alternative analytical solution[6] would offer a superior balance of speed and realism by better mimicking the shape of numerical simulation outputs.
ORC Efficiency: The power generation results rely on the GEOPHIRES built-in supercritical ORC efficiency correlation, which assumes the selection of an optimal working fluid for each specific geofluid temperature. For further details, please refer to the Surface Plant section in the Theoretical Basis for GEOPHIRES. GEOPHIRES warns that the built-in ORC correlations may not be valid above a production temperature of 200℃; the case study production temperature (approximately 218℃) exceeds this, which adds uncertainty to the modeled conversion efficiency and power plant cost. This limitation may be addressed in the future by FGEM integration.
References¶
Akindipe, D. and Witter. E. (2025). “2025 Geothermal Drilling Cost Curves Update”. https://pangea.stanford.edu/ERE/db/GeoConf/papers/SGW/2025/Akindipe.pdf?t=1740084555
Baytex Energy. (2024). Eagle Ford Presentation. https://www.baytexenergy.com/content/uploads/2024/04/24-04-Baytex-Eagle-Ford-Presentation.pdf
Beckers, K., McCabe, K. (2019) GEOPHIRES v2.0: updated geothermal techno-economic simulation tool. Geotherm Energy 7,5. https://doi.org/10.1186/s40517-019-0119-6
BLS. (2026a, June 10). Consumer Price Index – May 2026. https://www.bls.gov/news.release/archives/cpi_06102026.htm
BLS. (2026b, September 11). Consumer Price Index – August 2026. https://www.bls.gov/news.release/archives/cpi_09112026.htm
BPA. (2025, October). 2026 Transmission, Ancillary, and Control Area Service Rate Schedules and General Rate Schedule Provisions (FY 2026–2028). https://www.bpa.gov/-/media/Aep/rates-tariff/bp-26/Final-Transmission-Rate-Schedules-and-GRSPs.pdf
CTVC. (2025, September 2). The $783m PPA that keeps on drilling #260. https://www.ctvc.co/the-783m-ppa-that-keeps-on-drilling-260/
DeGolyer and MacNaughton. (2024, September 24). Report as of June 30, 2024 on Heat Initially In Place associated with the Project Cape Area prepared for Fervo Energy. Securities and Exchange Commission, Exhibit 99.1. https://www.sec.gov/Archives/edgar/data/1853868/000162828026025821/exhibit991-sx1.htm
El-Sadi, K., Gierke, B., Howard, E., & Gradl, C. (2024). Review of drilling performance in a horizontal EGS development. Proceedings of the 49th Workshop on Geothermal Reservoir Engineering, Stanford University, Stanford, CA. https://pangea.stanford.edu/ERE/db/GeoConf/papers/SGW/2024/Elsadi.pdf
Fercho, S., Matson, G., McConville, E., Rhodes, G., Jordan, R., Norbeck, J.. (2024, February 12). Geology, Temperature, Geophysics, Stress Orientations, and Natural Fracturing in the Milford Valley, UT Informed by the Drilling Results of the First Horizontal Wells at the Cape Modern Geothermal Project. https://pangea.stanford.edu/ERE/db/GeoConf/papers/SGW/2024/Fercho.pdf
Fercho, S., Norbeck, J., Dadi, S., Matson, G., Borell, J., McConville, E., Webb, S., Bowie, C., & Rhodes, G. (2025). Update on the geology, temperature, fracturing, and resource potential at the Cape Geothermal Project informed by data acquired from the drilling of additional horizontal EGS wells. Proceedings of the 50th Workshop on Geothermal Reservoir Engineering, Stanford University, Stanford, CA. https://pangea.stanford.edu/ERE/pdf/IGAstandard/SGW/2025/Fercho.pdf
Fervo Energy. (2023a, September 19). Fervo’s Commercialization Plans for Enhanced Geothermal Systems ( EGS). https://egi.utah.edu/wp-content/uploads/2023/09/09.45-Emma-McConville-Fervo_EGI_Sept-19-2023.pdf
Fervo Energy. (2023b, September 25). Fervo Energy Breaks Ground on the World’s Largest Next-gen Geothermal Project. https://fervoenergy.com/fervo-energy-breaks-ground-on-the-worlds-largest-next-gen-geothermal-project/
Fervo Energy. (2024, September 10). Fervo Energy’s Record-Breaking Production Results Showcase Rapid Scale Up of Enhanced Geothermal. https://www.businesswire.com/news/home/20240910997008/en/Fervo-Energys-Record-Breaking-Production-Results-Showcase-Rapid-Scale-Up-of-Enhanced-Geothermal
Fervo Energy. (2025a, March 31). Geothermal Mythbusting: Water Use and Impacts. https://fervoenergy.com/geothermal-mythbusting-water-use-and-impacts/
Fervo Energy. (2025b, April 15). Fervo Energy Announces 31 MW Power Purchase Agreement with Shell Energy. https://fervoenergy.com/fervo-energy-announces-31-mw-power-purchase-agreement-with-shell-energy/
Fervo Energy. (2025c, June 11). Fervo Energy Secures $206 Million In New Financing To Accelerate Cape Station Development. https://fervoenergy.com/fervo-secures-new-financing-to-accelerate-development/
Fervo Energy. (2026a, August 12). Fervo Energy Reports Second Quarter 2026 Results. https://fervoenergy.com/fervo-energy-reports-second-quarter-2026-results/
Fervo Energy. (2026b, September 1). Fervo Energy and Google Sign 396 MW PPA. https://fervoenergy.com/fervo-energy-and-google-sign-396-mw-ppa/
Fervo Energy. (2026c, June 22). Fervo Energy Reports First Quarter 2026 Results. https://ir.fervoenergy.com/news-releases/news-release-details/fervo-energy-reports-first-quarter-2026-results
Fervo Energy. (2026d, May 11). Form S-1/A Registration Statement (Amendment No. 3). U.S. Securities and Exchange Commission. https://www.sec.gov/Archives/edgar/data/1853868/000162828026033127/fervoenergy-sx1a3.htm
Fervo Energy. (2026e, September 24). Fervo Energy Achieves First Power at Cape Station, a Landmark Moment for the Future of Enhanced Geothermal Systems. https://fervoenergy.com/fervo-energy-achieves-first-power-at-cape-station-a-landmark-moment-for-the-future-of-enhanced-geothermal-systems/
Fervo Energy. (2026f, August 12). Fervo Energy (FRVO) Q2 2026 Earnings Call Transcript. The Motley Fool, published August 19, 2026. https://www.fool.com/earnings/call-transcripts/2026/08/19/fervo-energy-frvo-q2-2026-earnings-call-transcript/ (webcast replay: https://edge.media-server.com/mmc/p/va49yxkc/)
Fervo Energy. (2026g, August 12). Q2 2026 Quarterly Results [Earnings presentation]. https://ir.fervoenergy.com/static-files/28260ce5-2ac0-458e-bfb7-2d80f3709cae
Fervo Energy. (2026h, August 13). Form 10-Q for the quarter ended June 30, 2026 (Project Granite Facility). U.S. Securities and Exchange Commission. https://www.sec.gov/Archives/edgar/data/1853868/000162828026056457/frvo-20260630.htm
Fervo Energy. (2026i, March 19). Fervo Energy Secures $421 Million in Non-Recourse Project Financing for Cape Station. https://fervoenergy.com/fervo-energy-secures-421-million-in-non-recourse-project-financing-for-cape-station/
Fervo Energy. (2026j, October 1). Fervo Energy Declares Commercial Operation at Cape Station Ahead of Schedule, Leading the Race for Next-Generation Geothermal Energy. https://www.globenewswire.com/news-release/2026/10/01/3372717/0/en/fervo-energy-declares-commercial-operation-at-cape-station-ahead-of-schedule-leading-the-race-for-next-generation-geothermal-energy.html
Gradl, C. (2018). Review of Recent Unconventional Completion Innovations and their Applicability to EGS Wells. Stanford Geothermal Workshop. https://pangea.stanford.edu/ERE/pdf/IGAstandard/SGW/2018/Gradl.pdf
Horne, R., Genter, A., McClure, M. et al. (2025) Enhanced geothermal systems for clean firm energy generation. Nat. Rev. Clean Technol. 1, 148–160. https://doi.org/10.1038/s44359-024-00019-9
Jacobs, Trent. (2024, September 16). Fervo and FORGE Report Breakthrough Test Results, Signaling More Progress for Enhanced Geothermal. https://jpt.spe.org/fervo-and-forge-report-breakthrough-test-results-signaling-more-progress-for-enhanced-geothermal
Jacobs, Trent. (2025, September 5). Baker Hughes Nabs Award for Next Phase of Fervo Energy’s Geothermal Power Plant in Utah. https://jpt.spe.org/baker-hughes-nabs-award-for-next-phase-of-fervo-energygeothermal-power-plant-in-utah
Kellogg, R. (2009). Learning by drilling: Inter-firm learning and relationship persistence in the Texas oilpatch (NBER Working Paper No. 15060). National Bureau of Economic Research. https://www.nber.org/papers/w15060
Ko, S., Ghassemi, A., & Uddenberg, M. (2023). Selection and Testing of Proppants for EGS. Proceedings, 48th Workshop on Geothermal Reservoir Engineering, Stanford University, Stanford, California. https://pangea.stanford.edu/ERE/db/GeoConf/papers/SGW/2023/Ko.pdf
Latimer, T. (2025, February 12). Catching up with enhanced geothermal (D. Roberts, Interviewer). https://www.volts.wtf/p/catching-up-with-enhanced-geothermal
Lazard. (2026, July). Lazard’s Levelized Cost of Energy+ (LCOE+): Levelized Cost of Energy Comparison—Version 19.0 (p. 7). https://www.lazard.com/media/kcfconhf/lazards-lcoeplus_vf.pdf
Lowry, T. S., Finger, J. T., Carrigan, C. R., Foris, A., Kennedy, M. B., Corbet, T. F., Doughty, C. A., Pye, S., & Sonnenthal, E. L. (2017). GeoVision analysis: Reservoir maintenance and development task force report (SAND2017-9977). Sandia National Laboratories. https://doi.org/10.2172/1394062
Matson, M. (2024, September 11). Fervo Energy Technology Day 2024: Entering “the Geothermal Decade” with Next-Generation Geothermal Energy. https://www.linkedin.com/pulse/fervo-energy-technology-day-2024-entering-geothermal-decade-matson-n4stc/
McClure, M. (2024, September 12). Digesting the Bonkers, Incredible, Off-the-Charts, Spectacular Results from the Fervo and FORGE Enhanced Geothermal Projects. ResFrac Corporation Blog. https://www.resfrac.com/blog/digesting-the-bonkers-incredible-off-the-charts-spectacular-results-from-the-fervo-and-forge-enhanced-geothermal-projects
NCEI. US Climate Normals. https://www.ncei.noaa.gov/access/us-climate-normals/#dataset=normals-annualseasonal&timeframe=30&station=USC00425654
NREL. (2024). Annual Technology Baseline: Geothermal (2024). https://atb.nrel.gov/electricity/2024/geothermal
NREL. (2025, February 26). Annual Technology Baseline: Geothermal (2024b). https://atb.nrel.gov/electricity/2024b/geothermal
Norbeck, J. (2026, February 9). An Update of Activities and Plans at Fervo. Oral presentation at the 51st Workshop on Geothermal Reservoir Engineering, Stanford University, Stanford, CA. https://pangea.stanford.edu/ERE/db/GeoConf/Abstract.php?PaperID=9496
Norbeck, J., Gradl, C., Latimer, T. (2024, September 10). Deployment of Enhanced Geothermal System Technology Leads to Rapid Cost Reductions and Performance Improvements. https://doi.org/10.31223/X5VH8C
Norbeck J., Latimer T. (2023). Commercial-Scale Demonstration of a First-of-a-Kind Enhanced Geothermal System. https://doi.org/10.31223/X52X0B
Norton Rose Fulbright. (2025, July 7). Effects of “One Big Beautiful Bill” on Projects. https://www.projectfinance.law/publications/effects-of-one-big-beautiful-bill-on-projects
PacifiCorp. (2017, June 1). FAQ: Transmission and Ancillary Service Rate Changes. https://www.oasis.oati.com/PPW/PPWdocs/Rate_Update_FAQ_20170601.pdf
Quantum Proppant Technologies. (2020). Well Completion Technology. World Oil. https://quantumprot.com/uploads/images/2b8583e8ce8038681a19d5ad1314e204.pdf
Rocky Mountain Power. (2026, January 26). Notice of Intent to Use ECR Input and Proposed Tariff Changes to Electric Service Schedule No. 137, Net Billing Service. Public Service Commission of Utah. https://pscdocs.utah.gov/electric/26docs/26035T03/343554Trf1-26-2026.pdf
Seel, J., Manderlink, N., Mulvaney Kemp, J., Rand, J., Gorman, W., Wiser, R., Cotton, W., Porter, K. (2026, February). Generator Interconnection Costs to the Transmission System in non-ISO Balancing Authorities. Lawrence Berkeley National Laboratory. https://eta-publications.lbl.gov/sites/default/files/2026-02/lbnl_2026.02.23_ba_interconnection_costs.pdf
Shiozawa, S., & McClure, M. (2014). EGS Designs with Horizontal Wells, Multiple Stages, and Proppant. ResFrac. https://www.resfrac.com/wp-content/uploads/2024/07/Shiozawa.pdf
Singh, A., Galban, G., McClure, M. (2025, June 9). Proceedings of the 2025 Unconventional Resources Technology Conference. https://www.resfrac.com/wp-content/uploads/2025/06/Singh-2025-Fervo-Project-Cape.pdf
Southern Utah University. (2024, October 23). Fervo Energy, Southern Utah University, and Elemental Impact Launch Geothermal Drilling & Completions Apprenticeship Program. https://www.suu.edu/news/2024/10/geothermal-energy-joint-campaign.html
Turboden. (2025, October 2). Turboden selected to deliver 180 MW of Fervo’s Gen 2 ORC Power Plants at Cape Station in Utah. https://www.turboden.com/company/media/press/press-releases/4881/turboden-selected-to-deliver-180-mw-of-fervos-gen-2-orc-power-plants-at-cape-station-in-utah
U.S. Department of the Interior Bureau of Land Management. (2024, October). Finding of No Significant Impact and Decision Record DOI-BLM-UT-C010-2024-0018-EA. https://eplanning.blm.gov/public_projects/2033002/200625761/20120795/251020775/DOI-BLM-UT-C010-2024-0018-EA_FONSI_DR_%20Fervo%20EA_signed.pdf
US DOE. (2019). GeoVision: Harnessing the Heat Beneath Our Feet (p. 163, drilling cost scenarios). https://www.energy.gov/sites/prod/files/2019/06/f63/GeoVision-full-report-opt.pdf
US DOE. (2021). Combined Heat and Power Technology Fact Sheet Series: Waste Heat to Power. https://betterbuildingssolutioncenter.energy.gov/sites/default/files/attachments/Waste_Heat_to_Power_Fact_Sheet.pdf
Utility Dive. (2026, June 5). Fervo Energy faces transmission constraints in the West, analysts say. https://www.utilitydive.com/news/fervo-energy-geothermal-transmission-constraints/822141/
Xing, P., England, K., Moore, J., McLennan, J. (2025, February 10). Analysis of the 2024 Circulation Tests at Utah FORGE and the Response of Fiber Optic Sensing Data. https://pangea.stanford.edu/ERE/pdf/IGAstandard/SGW/2025/Xing2.pdf
Yearsley, E., Kombrink, H. (2024, November 6). A critical look at Fervo dataset suggests lower output. https://geoexpro.com/a-critical-look-at-fervo-dataset-suggests-lower-output/
Yusifov, M., & Enriquez, N. (2025, July). From Core to Code: Powering the Al Revolution with Geothermal Energy. Project InnerSpace. https://projectinnerspace.org/resources/Powering-the-AI-Revolution.pdf