
Project Red: Evaluating GEOPHIRES and Gringarten against Empirical EGS Data
Last Updated: 2026-07-08
Overview: This analysis[1] evaluates the accuracy of the analytical GEOPHIRES Gringarten reservoir model by comparing it against real-world EGS empirical data from the Fervo Energy Project Red site released in April 2026. For comparative context, it also includes the predictive temperature curve generated by Fervo’s proprietary modeling. The results suggest that the GEOPHIRES implementation of the Gringarten model serves as an effective, accessible tool for EGS techno-economic modeling, providing a rapid, computationally efficient complement to complex numerical simulators across the project lifecycle.
ℹ️ The GEOPHIRES parameters and result used in this evaluation can be interactively explored via the Fervo_Project_Red-2026 example in the web interface. Their source code is also available on GitHub: Fervo_Project_Red-2026.txt and Fervo_Project_Red-2026.out.
Disclaimer: Independent Analysis: This is an independent evaluation developed by the author and contributors to the GEOPHIRES open-source project. It is not affiliated with, sponsored by, or endorsed by Fervo Energy. The author and contributors are not employees or agents of Fervo Energy, and this work has not been reviewed or approved by the company. All modeling assumptions, including those derived from public data sources, represent the independent interpretation of the author and the GEOPHIRES open-source community and do not constitute proprietary information or official company projections.
Methodology
This section outlines the analytical approach used for this evaluation, detailing the extraction of empirical production data and the subsequent calibration of the GEOPHIRES reservoir parameters.
Empirical Data Extraction
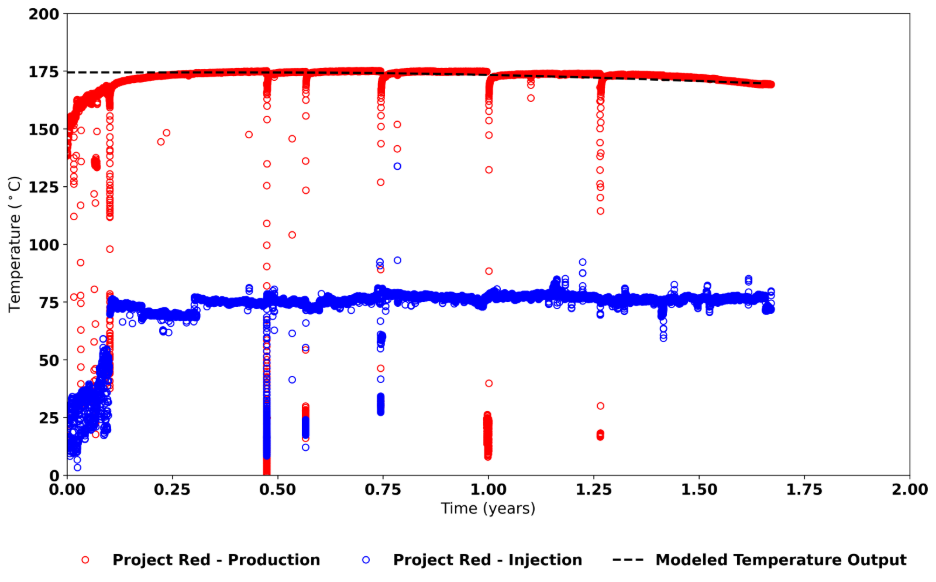
The baseline empirical production data for this evaluation was derived from Figure 5 of Fervo Energy’s report, Enhanced Geothermal Has Been Proven at Scale: Here’s What Two Years of Production Data Show (Fervo Energy, 2026).
Original Published Figure 5: Measured Flowing Temperature:
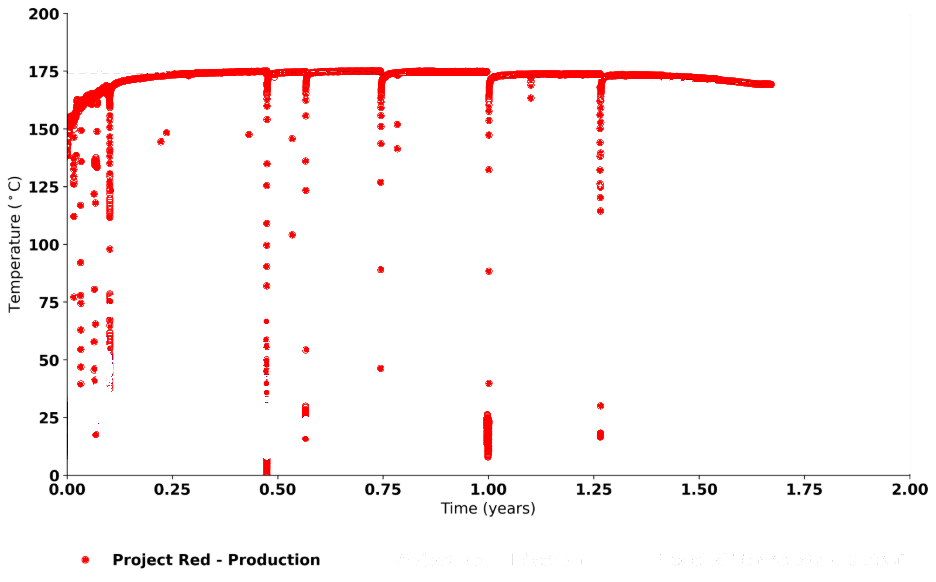
Extraction Limitations: It should be noted that this analysis contains inherent limitations. Because the raw underlying dataset is not publicly available, the data points were semi-manually extracted from the published chart using Optical Character Recognition (OCR) and image processing techniques. While sufficient for macro-level validation, this extraction method inevitably introduces minor digitization artifacts and precision imperfections compared to the raw sensor data.
Pre-processed image isolating the production temperature data series for OCR extraction:
Model Parameterization and Calibration
The foundation of this validation lies in aligning the GEOPHIRES Project Red example inputs with the physical realities of the Fervo Project Red site. To achieve this, GEOPHIRES parameters consumed by the Gringarten reservoir model (Gringarten, 1975) were calibrated using published data and physical constraints derived from the site’s initial reporting (Norbeck & Latimer, 2023) and recent updates.
GEOPHIRES Reservoir Parameters
The parameters detailed below reflect the updated Fervo_Project_Red-2026 GEOPHIRES example, which serves as a revision of the
original Fervo_Norbeck_Latimer_2023 version, calibrated using the latest multi-year empirical data.
The GEOPHIRES Gringarten model utilizes a multiple parallel fracture geometry. The critical inputs defining this geometry for the Project Red simulation are detailed below:
Parameter |
Input Value |
Derivation Notes |
|---|---|---|
Number of Fractures |
|
Fervo estimates between 75 and 100 fractures were created. This value is de-rated in the model to account for the physical reality of imperfect flow distribution and uneven utilization across the entire stimulated rock volume (Norbeck and Latimer, 2023). |
Fracture Shape |
|
Rectangular geometry (Shape 4), representing standard transverse hydraulic fractures along a horizontal wellbore. |
Fracture Height |
|
Estimated vertical propagation of the stimulated fracture network. |
Fracture Width |
|
Set to match the distance between the injection and production wellbores, assuming a dipole flow field directly connecting the laterals. |
Fracture Separation |
|
The modeled physical spacing between individual transverse fractures along the lateral section. |
Note that these parameters represent a simplified, homogenized analytical equivalent of a highly complex, heterogeneous subsurface fracture network. Further relevant detailed discussion can be found in the Cape Station case study methodology section. See also the effective number of fractures sensitivity analysis below.
Results
Production Temperature: Measured vs. Modeled
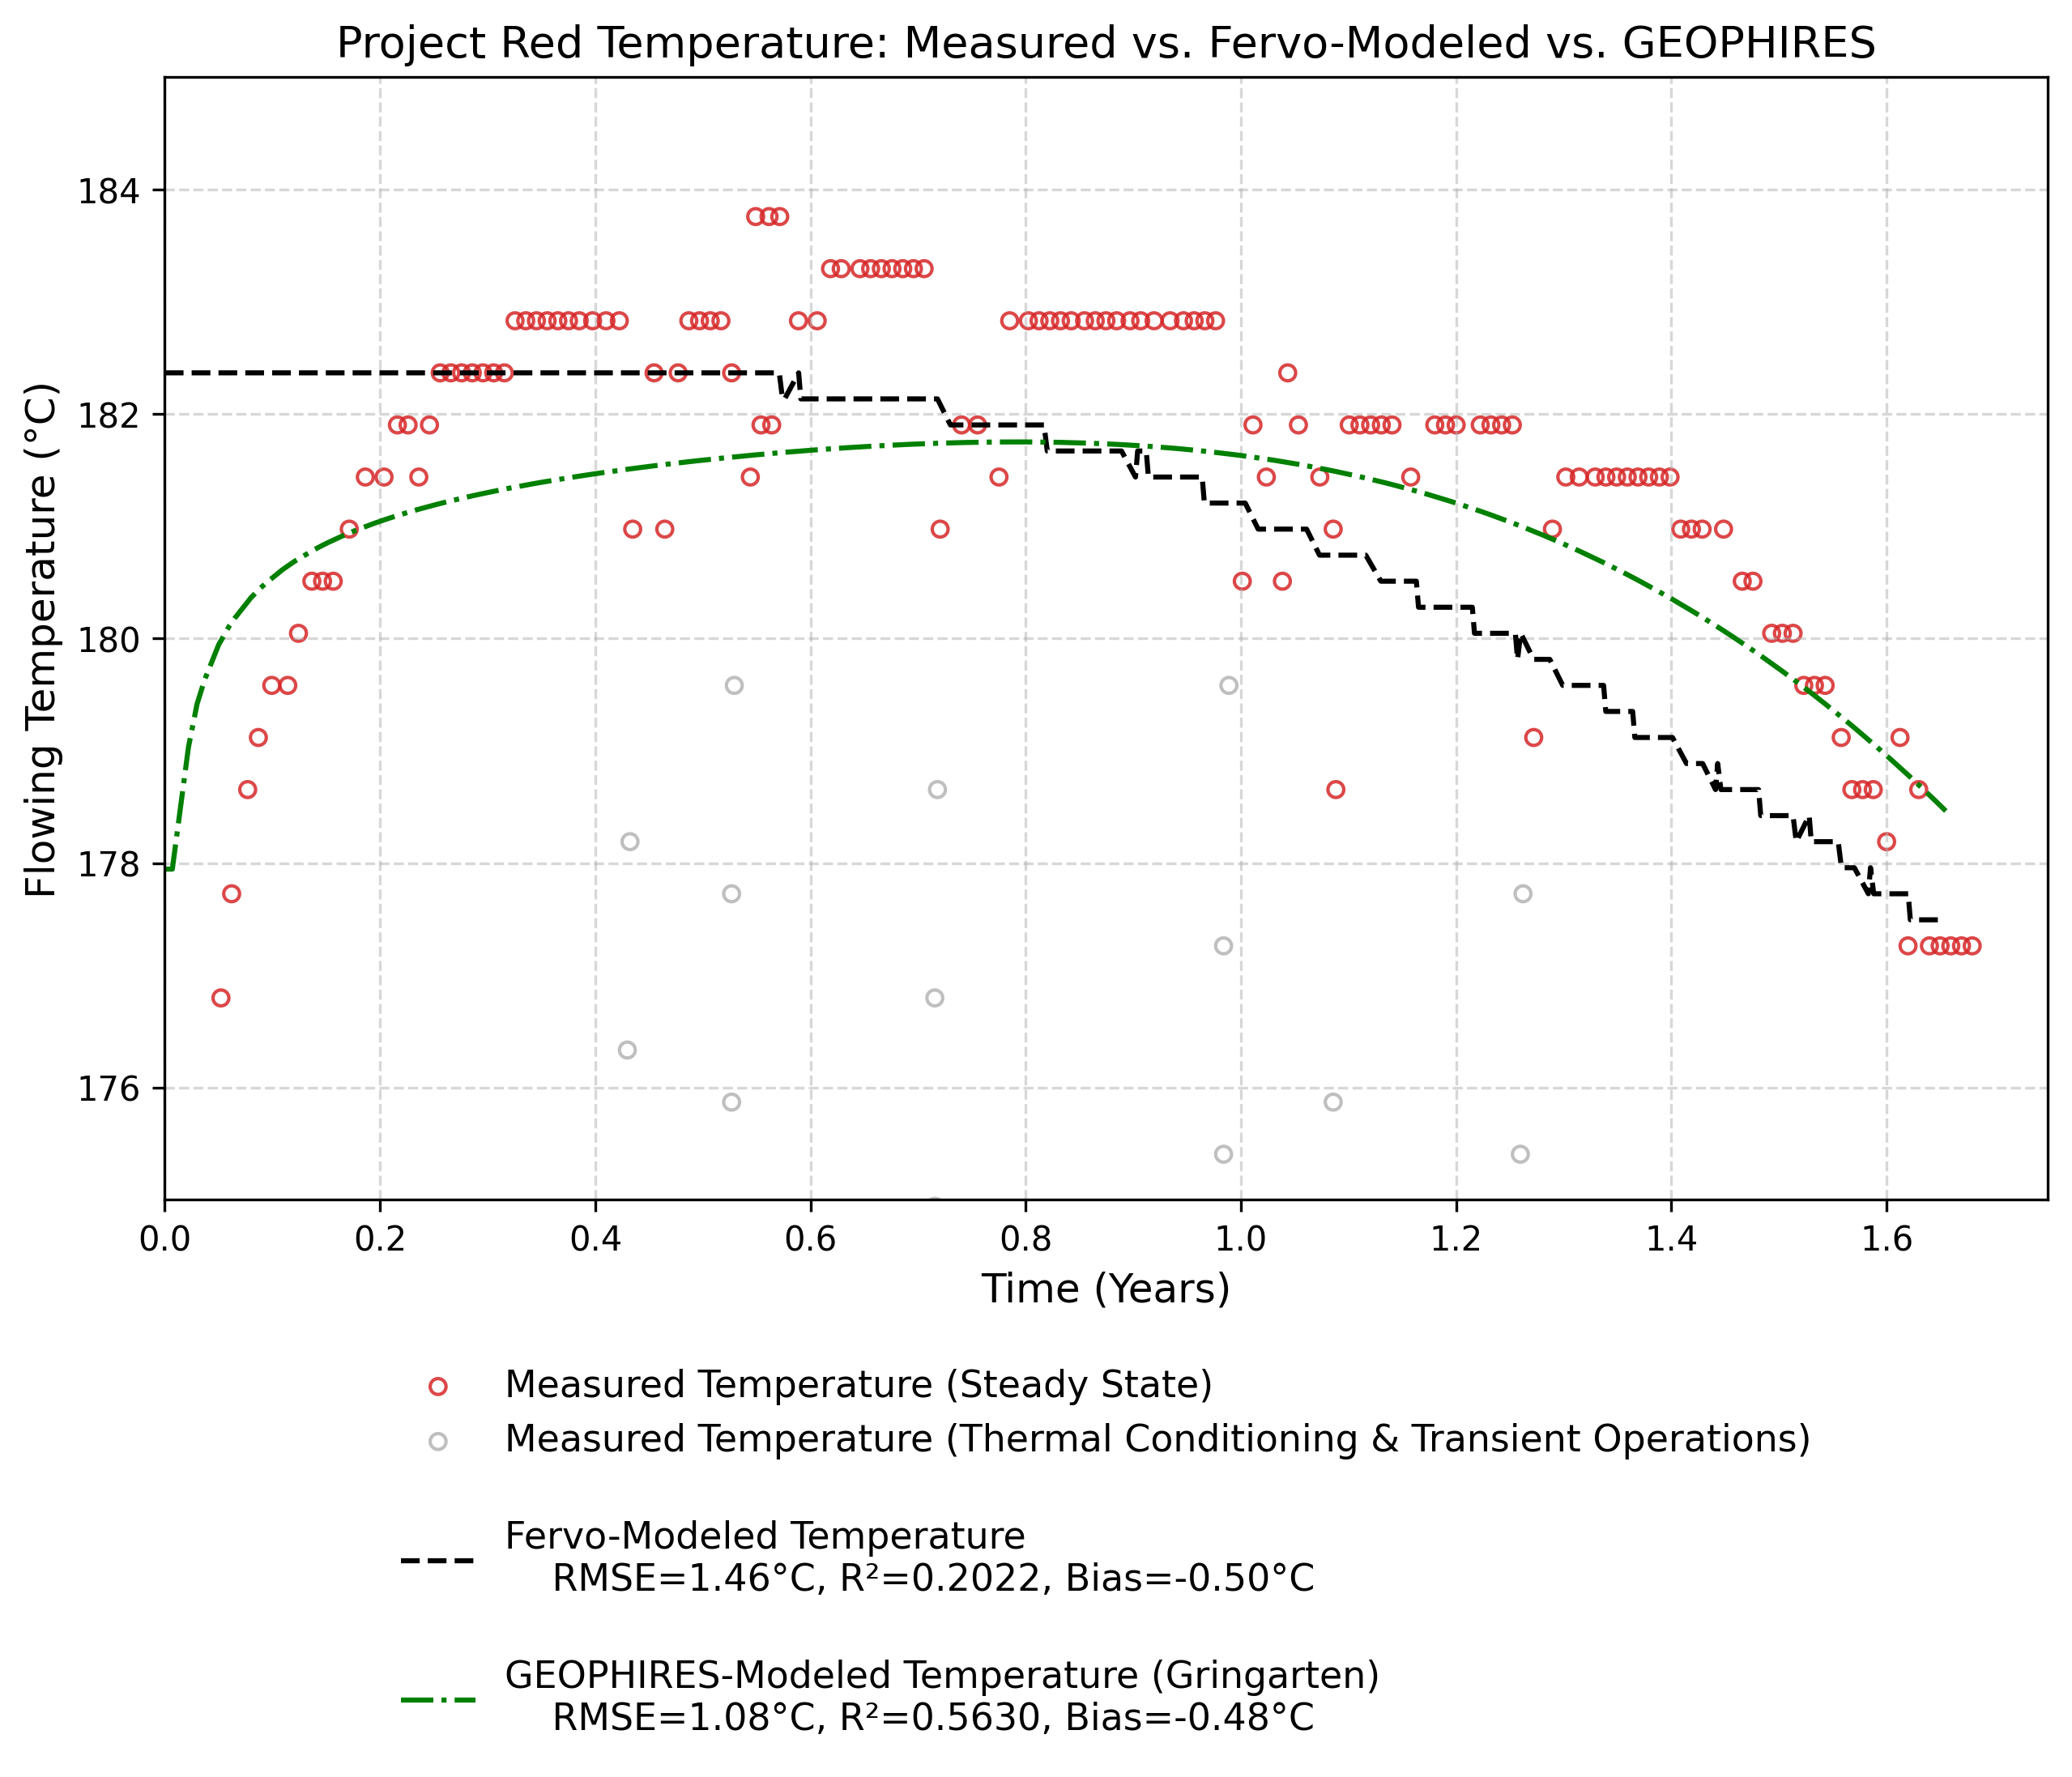
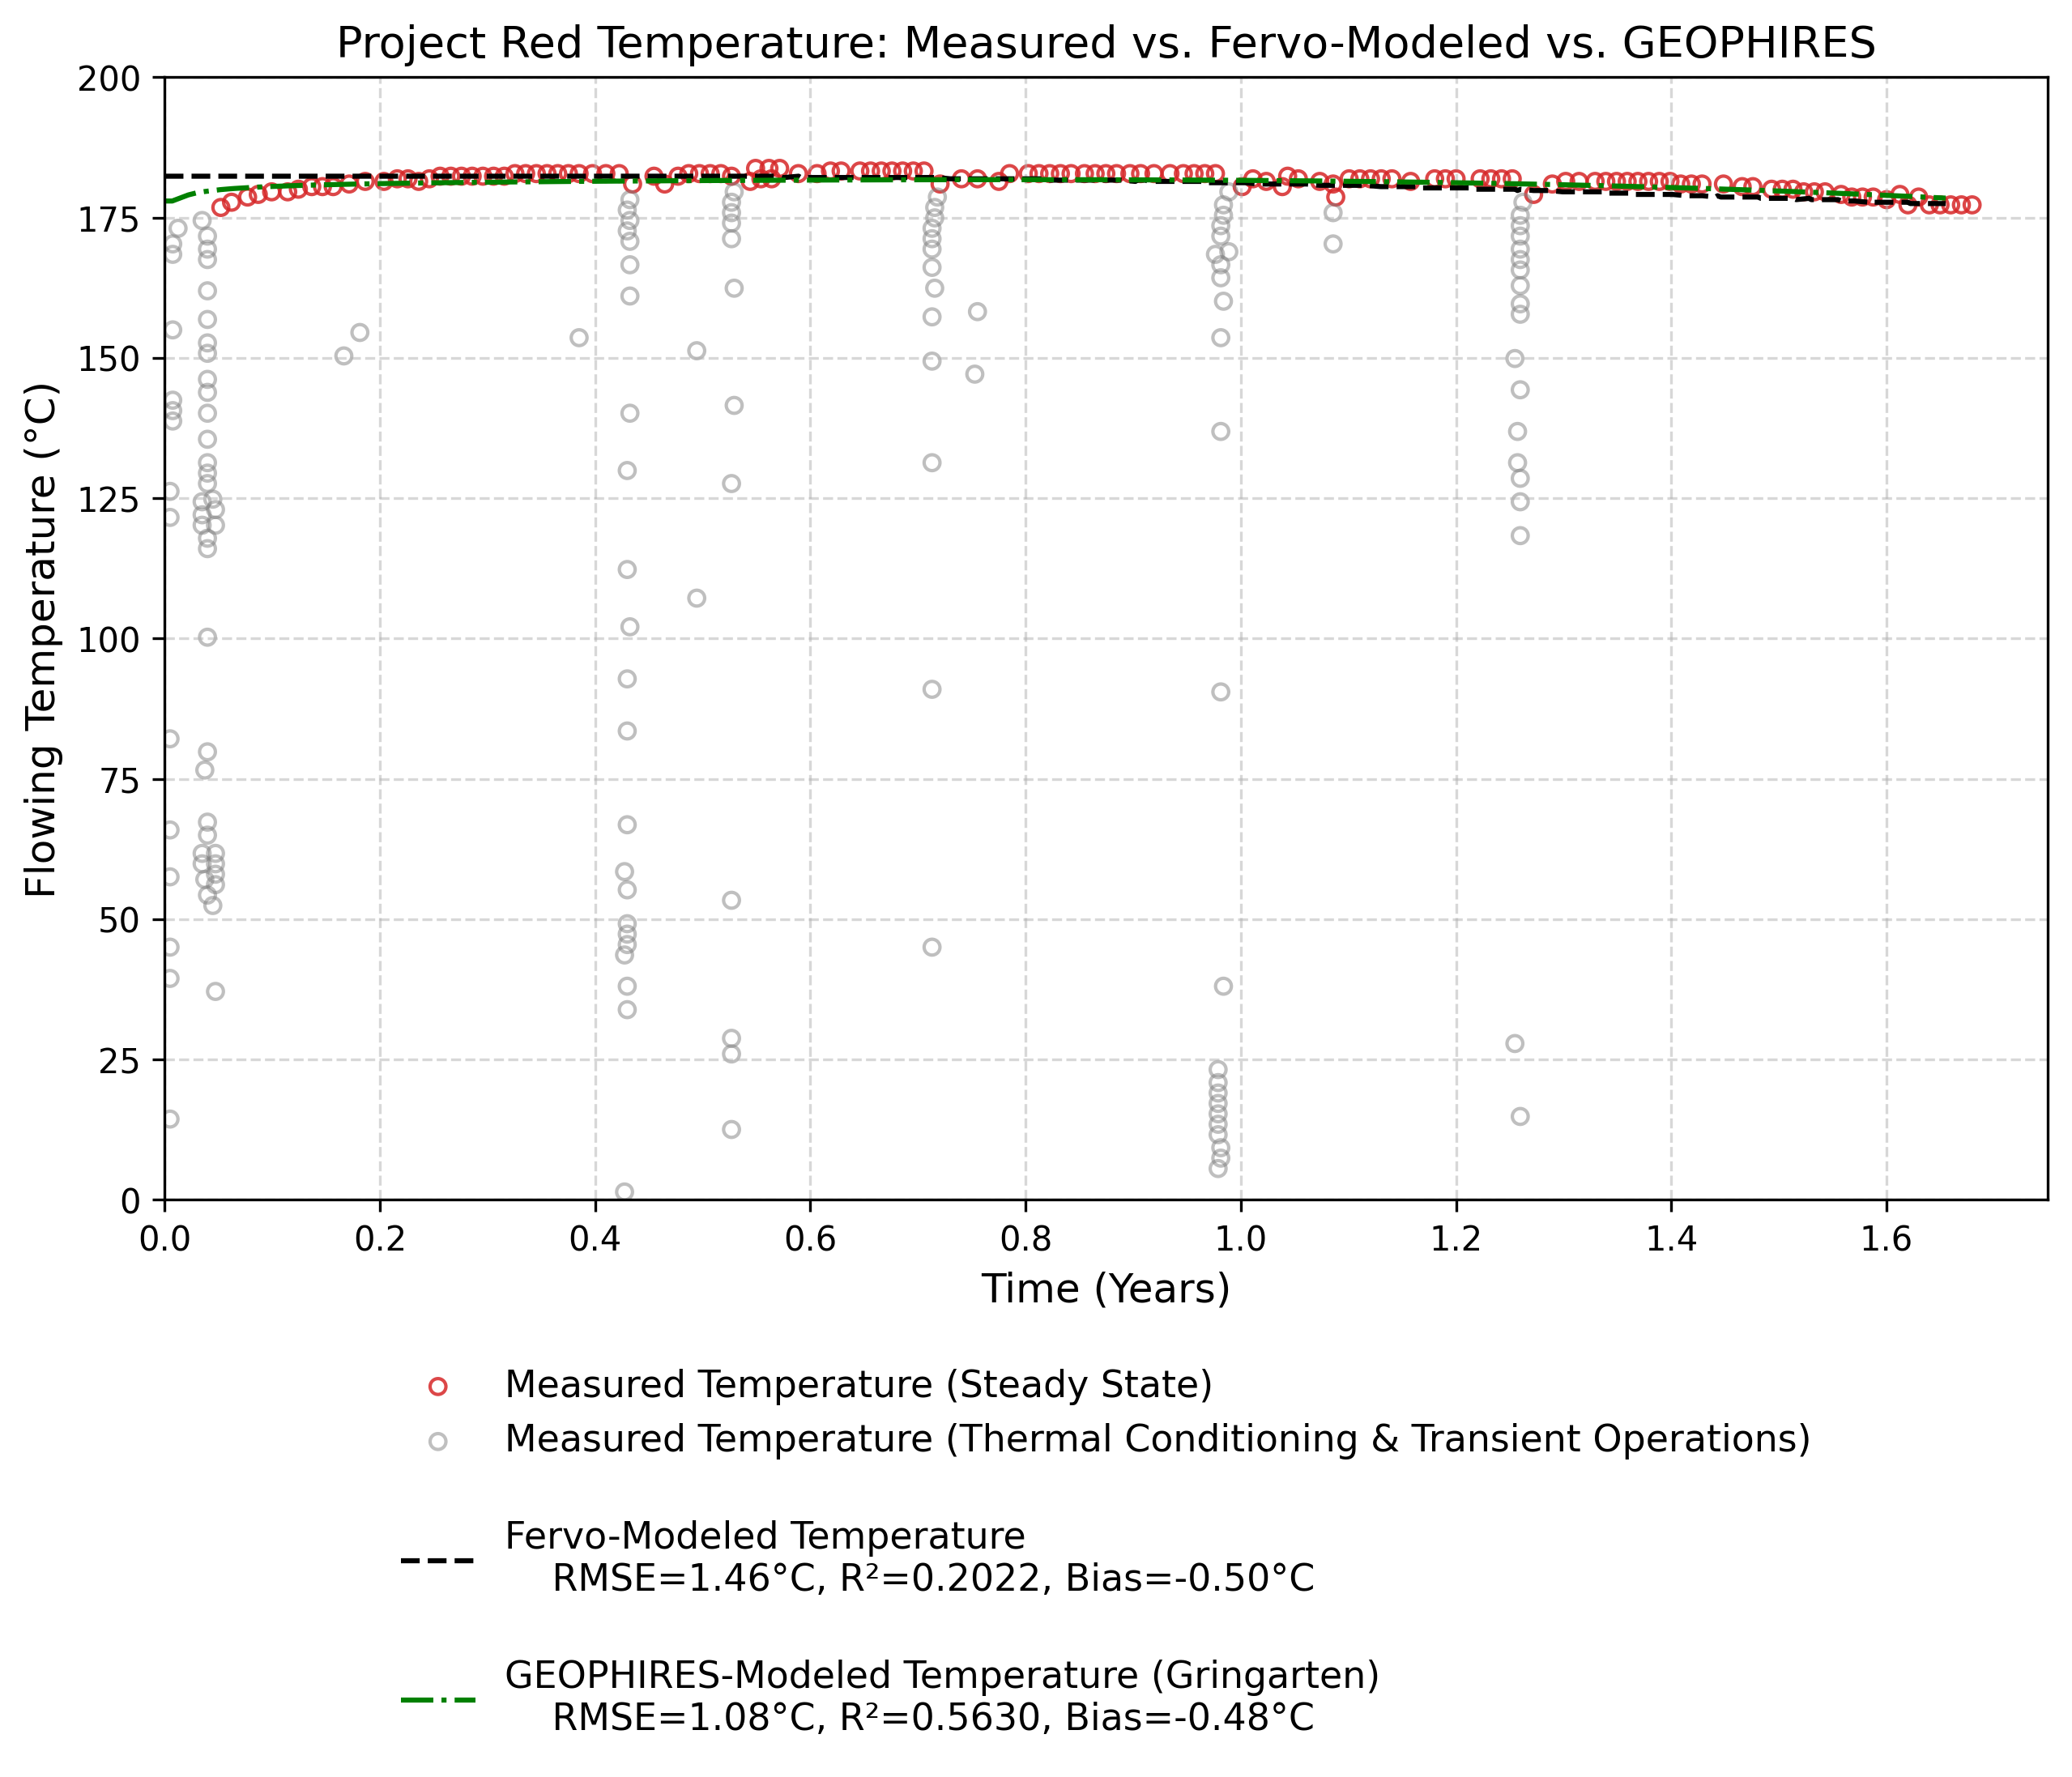
The charts below plot the measured flowing temperature over a roughly two-year period, extracted as described in the methodology section. Data points captured during early thermal conditioning and transient operations (e.g., shut-ins, flow-rate testing) are rendered in gray and excluded from the steady-state statistical alignment.
Detail view of the steady-state temperature plateau (175°C–185°C):
Statistical Alignment Analysis
Steady-State Alignment and Thresholding
Aligning the extracted data for statistical analysis requires establishing a threshold between the initial thermal conditioning phase and steady-state operations. This boundary is an analytical judgment call necessitated by structural differences in the models: the Fervo curve appears to assume an idealized steady-state flow from inception, omitting the early thermal ramp-up phase entirely. Conversely, while the GEOPHIRES Gringarten model does account for early transient heat transfer, its precision during this rapid ramp-up is inherently constrained by its temporal resolution (100 time steps per year).
Variance Analysis
The variance analysis (results displayed in legend captions) evaluates the predictive accuracy of both models against the measured steady-state data (excluding the initial thermal conditioning/ramp-up period).
Model |
RMSE (°C) |
R² |
Mean Bias (°C) |
|---|---|---|---|
Fervo |
1.46 |
0.2022 |
-0.50 |
GEOPHIRES/Gringarten |
1.08 |
0.5630 |
-0.48 |
Both models demonstrate high predictive fidelity, tracking steady-state flowing temperatures within 1.5°C of the empirical data.
Overall Fit: GEOPHIRES mathematically achieves a tighter overall fit, yielding a lower Root Mean Square Error (RMSE) and a higher coefficient of determination (R²).
Systematic Bias: The GEOPHIRES model exhibits slightly less systemic underestimation, with a cold bias of -0.48°C compared to the Fervo cold bias of -0.50°C.
R² Context: While the Fervo model yields a relatively low R² (0.2022), GEOPHIRES achieves a stronger R² of 0.5630, indicating it more successfully captures the underlying physical trend of the data (the slight thermal drawdown) rather than simply averaging the noise. However, it is important to note that the absolute R² ceiling for both models is inherently suppressed by the dataset. Because the steady-state temperature profile is essentially a flat plateau, natural sensor variance and minor reservoir oscillations may account for a disproportionately large portion of the total variance, keeping the R² scores modest despite the favorable absolute error (RMSE).
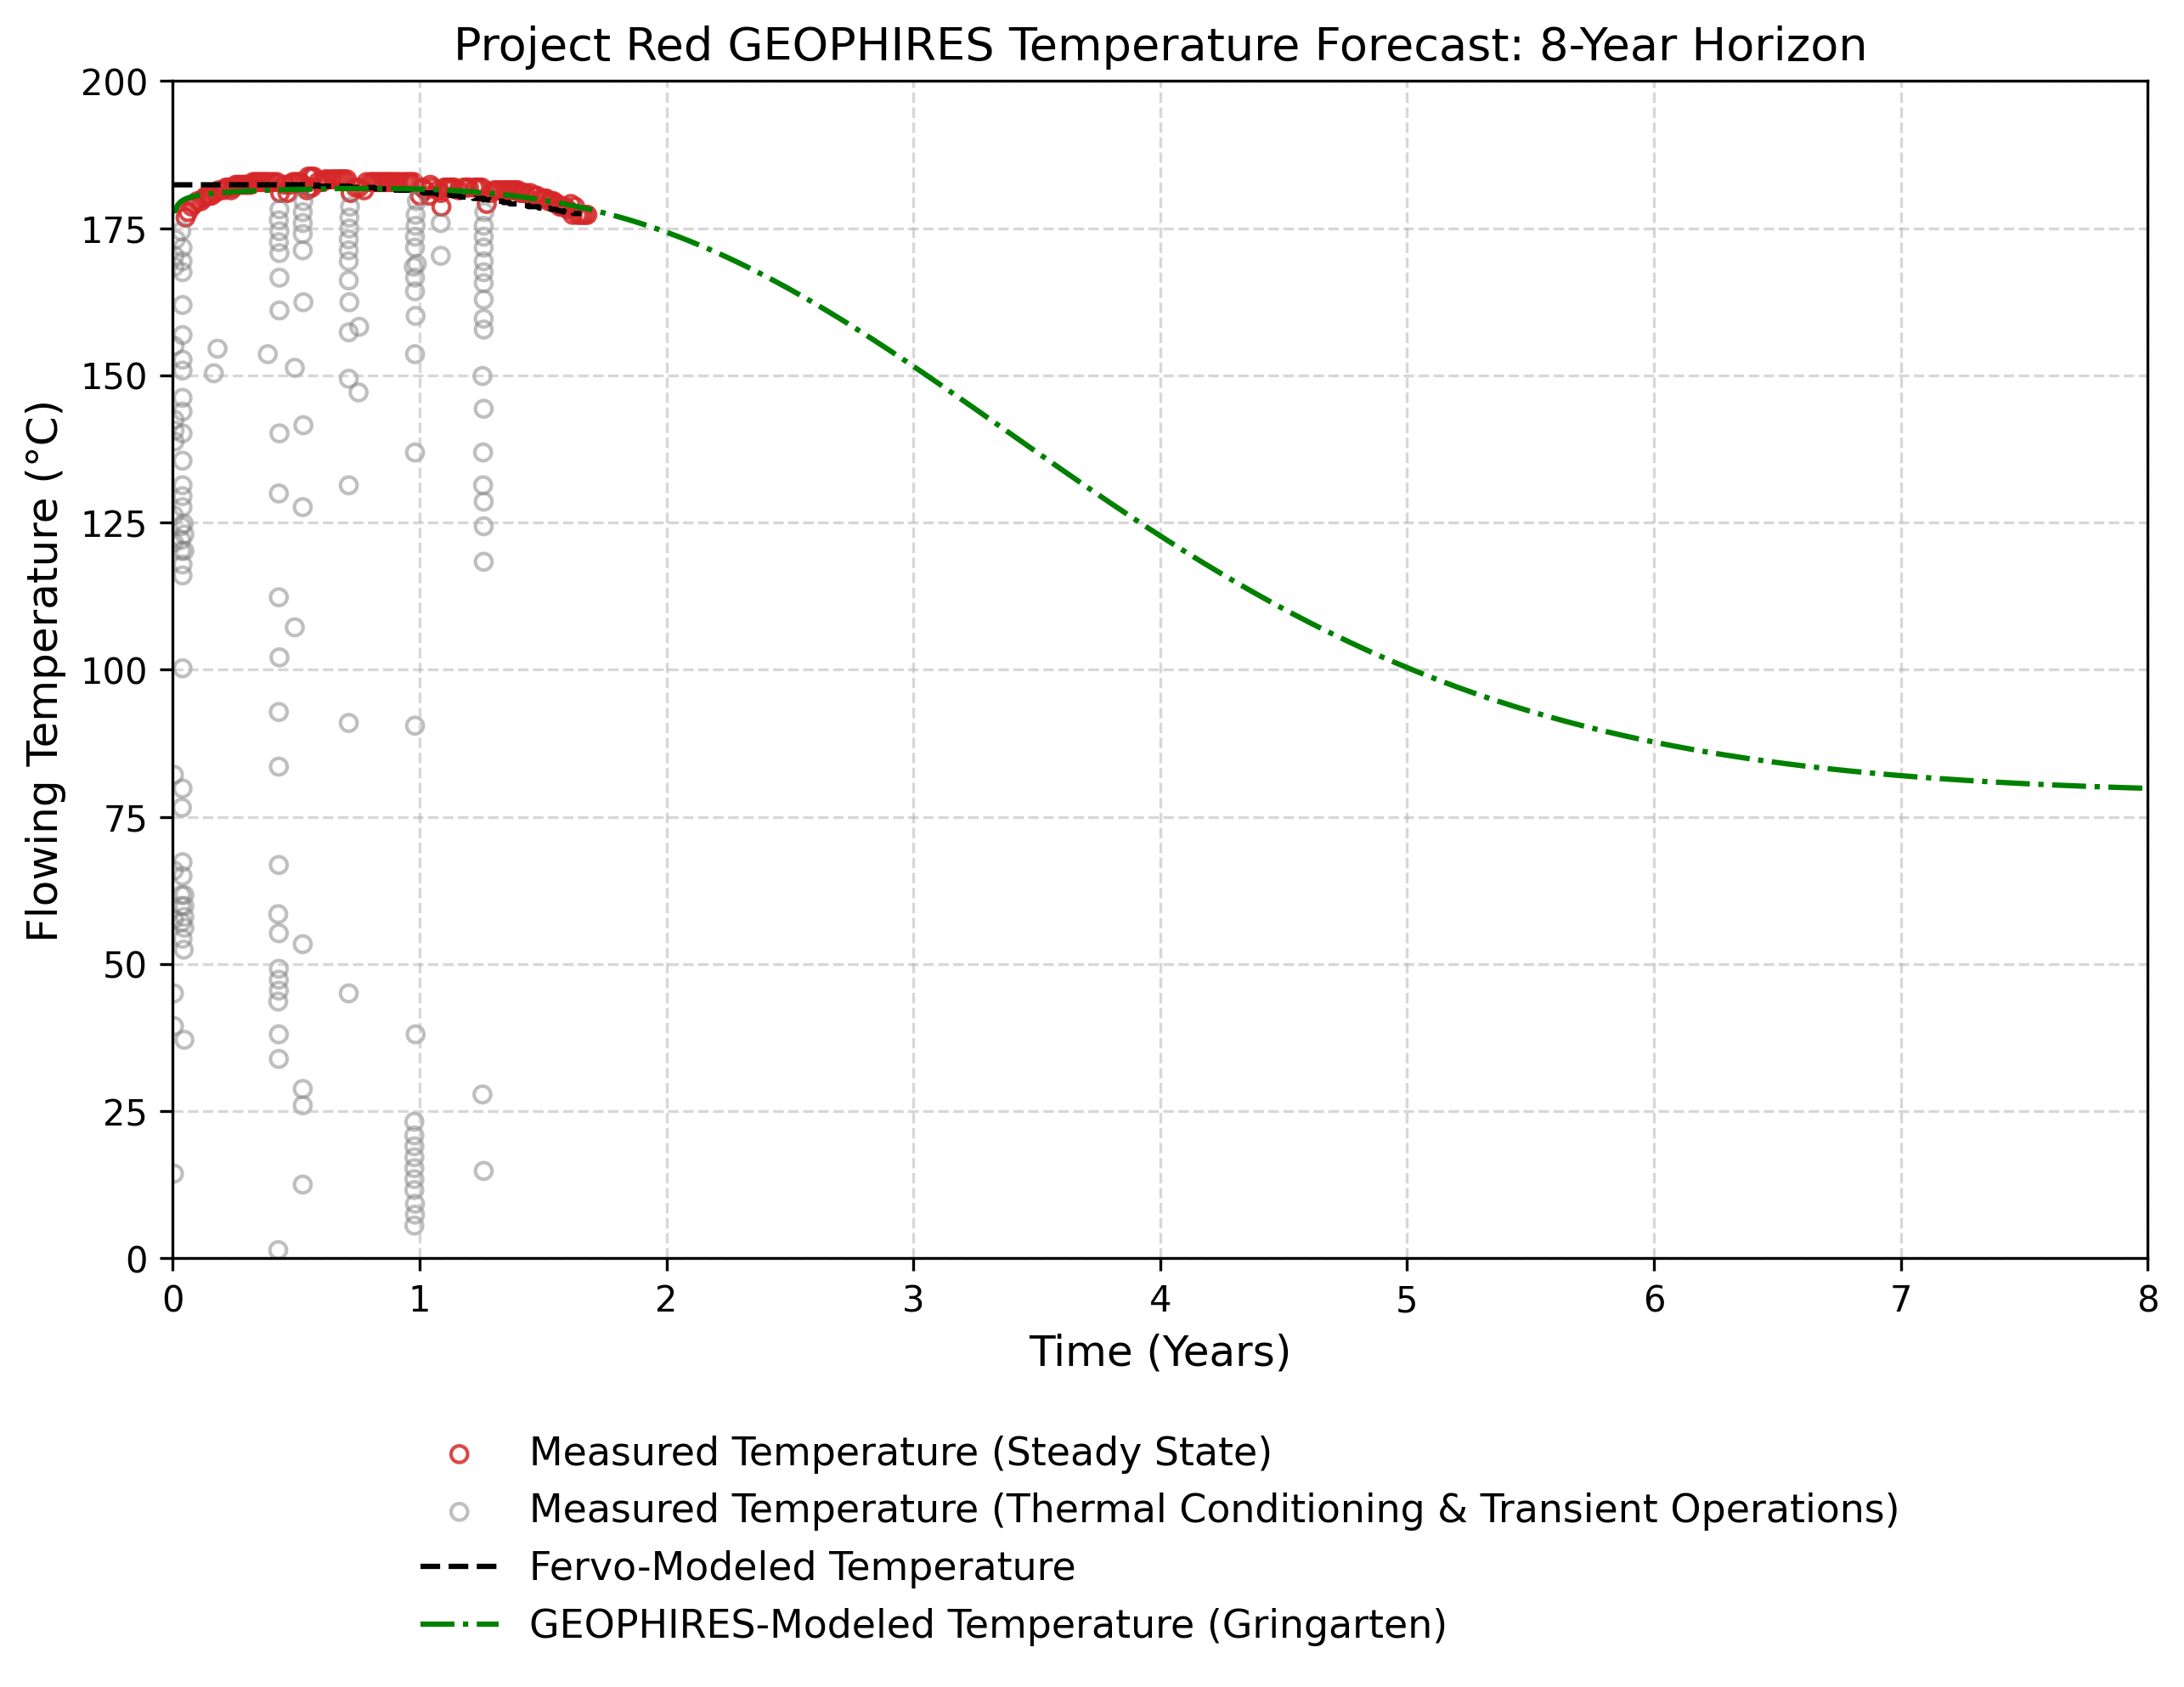
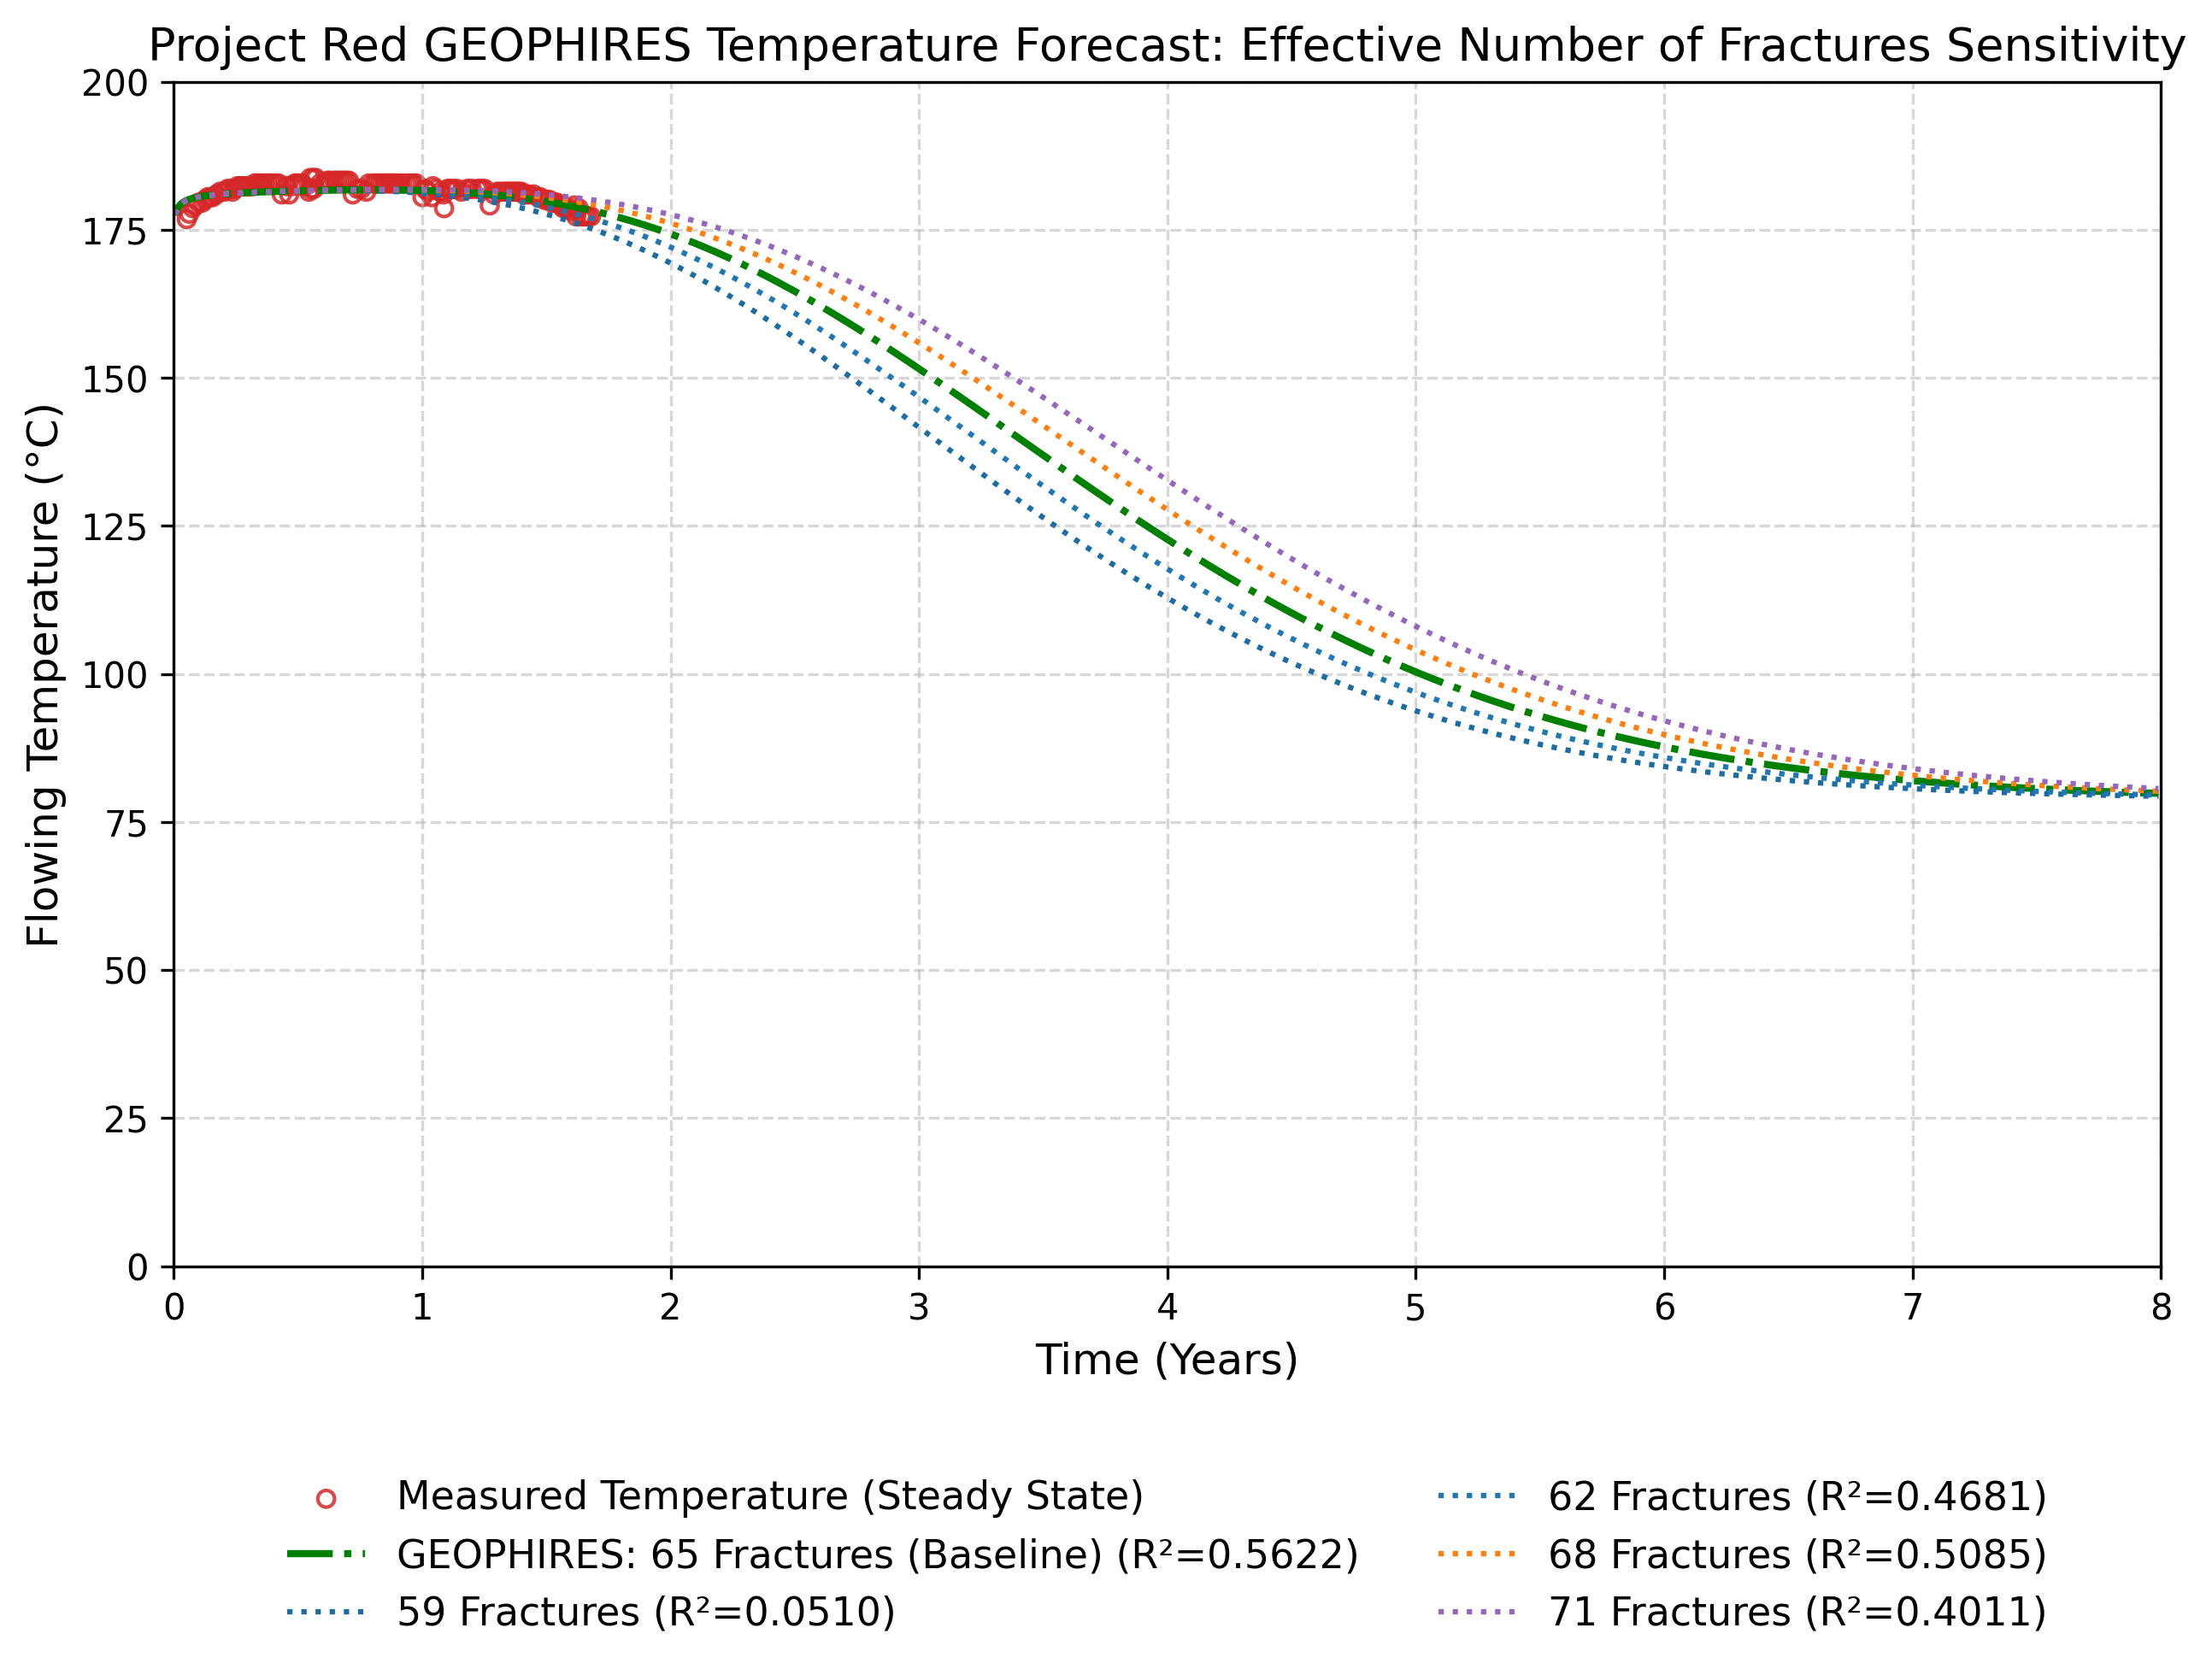
Long-Term Forecast (8-Year Horizon)
To evaluate the model’s predictive behavior over a longer timeframe, the GEOPHIRES simulation was extended to an 8-year horizon. This timeframe aligns with the redrilling interval modeled in the Cape Station case study and provides a plausible view of the anticipated thermal decline before major wellfield intervention would be required.
As shown in the forecast above, the Gringarten analytical model predicts a gradual onset of thermal decline following the initial two-year plateau, which eventually accelerates into a more pronounced drawdown. When interpreting the trailing edge of the empirical dataset, minor deviations between the extracted data and the forecast curve are to be expected given the inherent imprecision of image-based data digitization and the presence of localized wellbore transients.
Because Fervo has explicitly characterized this two-year operational period as demonstrating highly stable flowing temperatures with marginal to no actual reservoir drawdown, the GEOPHIRES parameterization deliberately favors a stabilized, slightly more optimistic decline curve rather than overfitting to potential extraction artifacts.
While this 8-year forecast establishes a testable predictive baseline, understanding the true bounds of this decline requires accounting for inherent subsurface uncertainty. To explore how variations in reservoir geometry might accelerate or delay the onset of this long-term drawdown, the following sensitivity analysis expands our single baseline into a predictive envelope.
Sensitivity Analysis: Effective Number of Fractures
As detailed in the methodology’s GEOPHIRES Reservoir Parameters table, the baseline
Number of Fractures (65) represents a deliberately de-rated analytical
equivalent designed to proxy a highly complex, heterogeneous subsurface fracture network. While this calibrated
baseline provides the tightest statistical fit for the current two-year empirical window, assigning an exact number to
the effective fracture surface area inherently relies on analytical interpretation.
To evaluate the bounding envelope of the reservoir’s thermal drawdown, a sensitivity analysis was performed on this
effective Number of Fractures. By expanding the model to include other plausible values (ranging from 59 to 71
fractures), the analysis demonstrates the sensitivity of the long-term thermal decline to the idealized fracture surface area.
Detail view of the sensitivity curves overlapping the empirical steady-state data (Years 0–3):
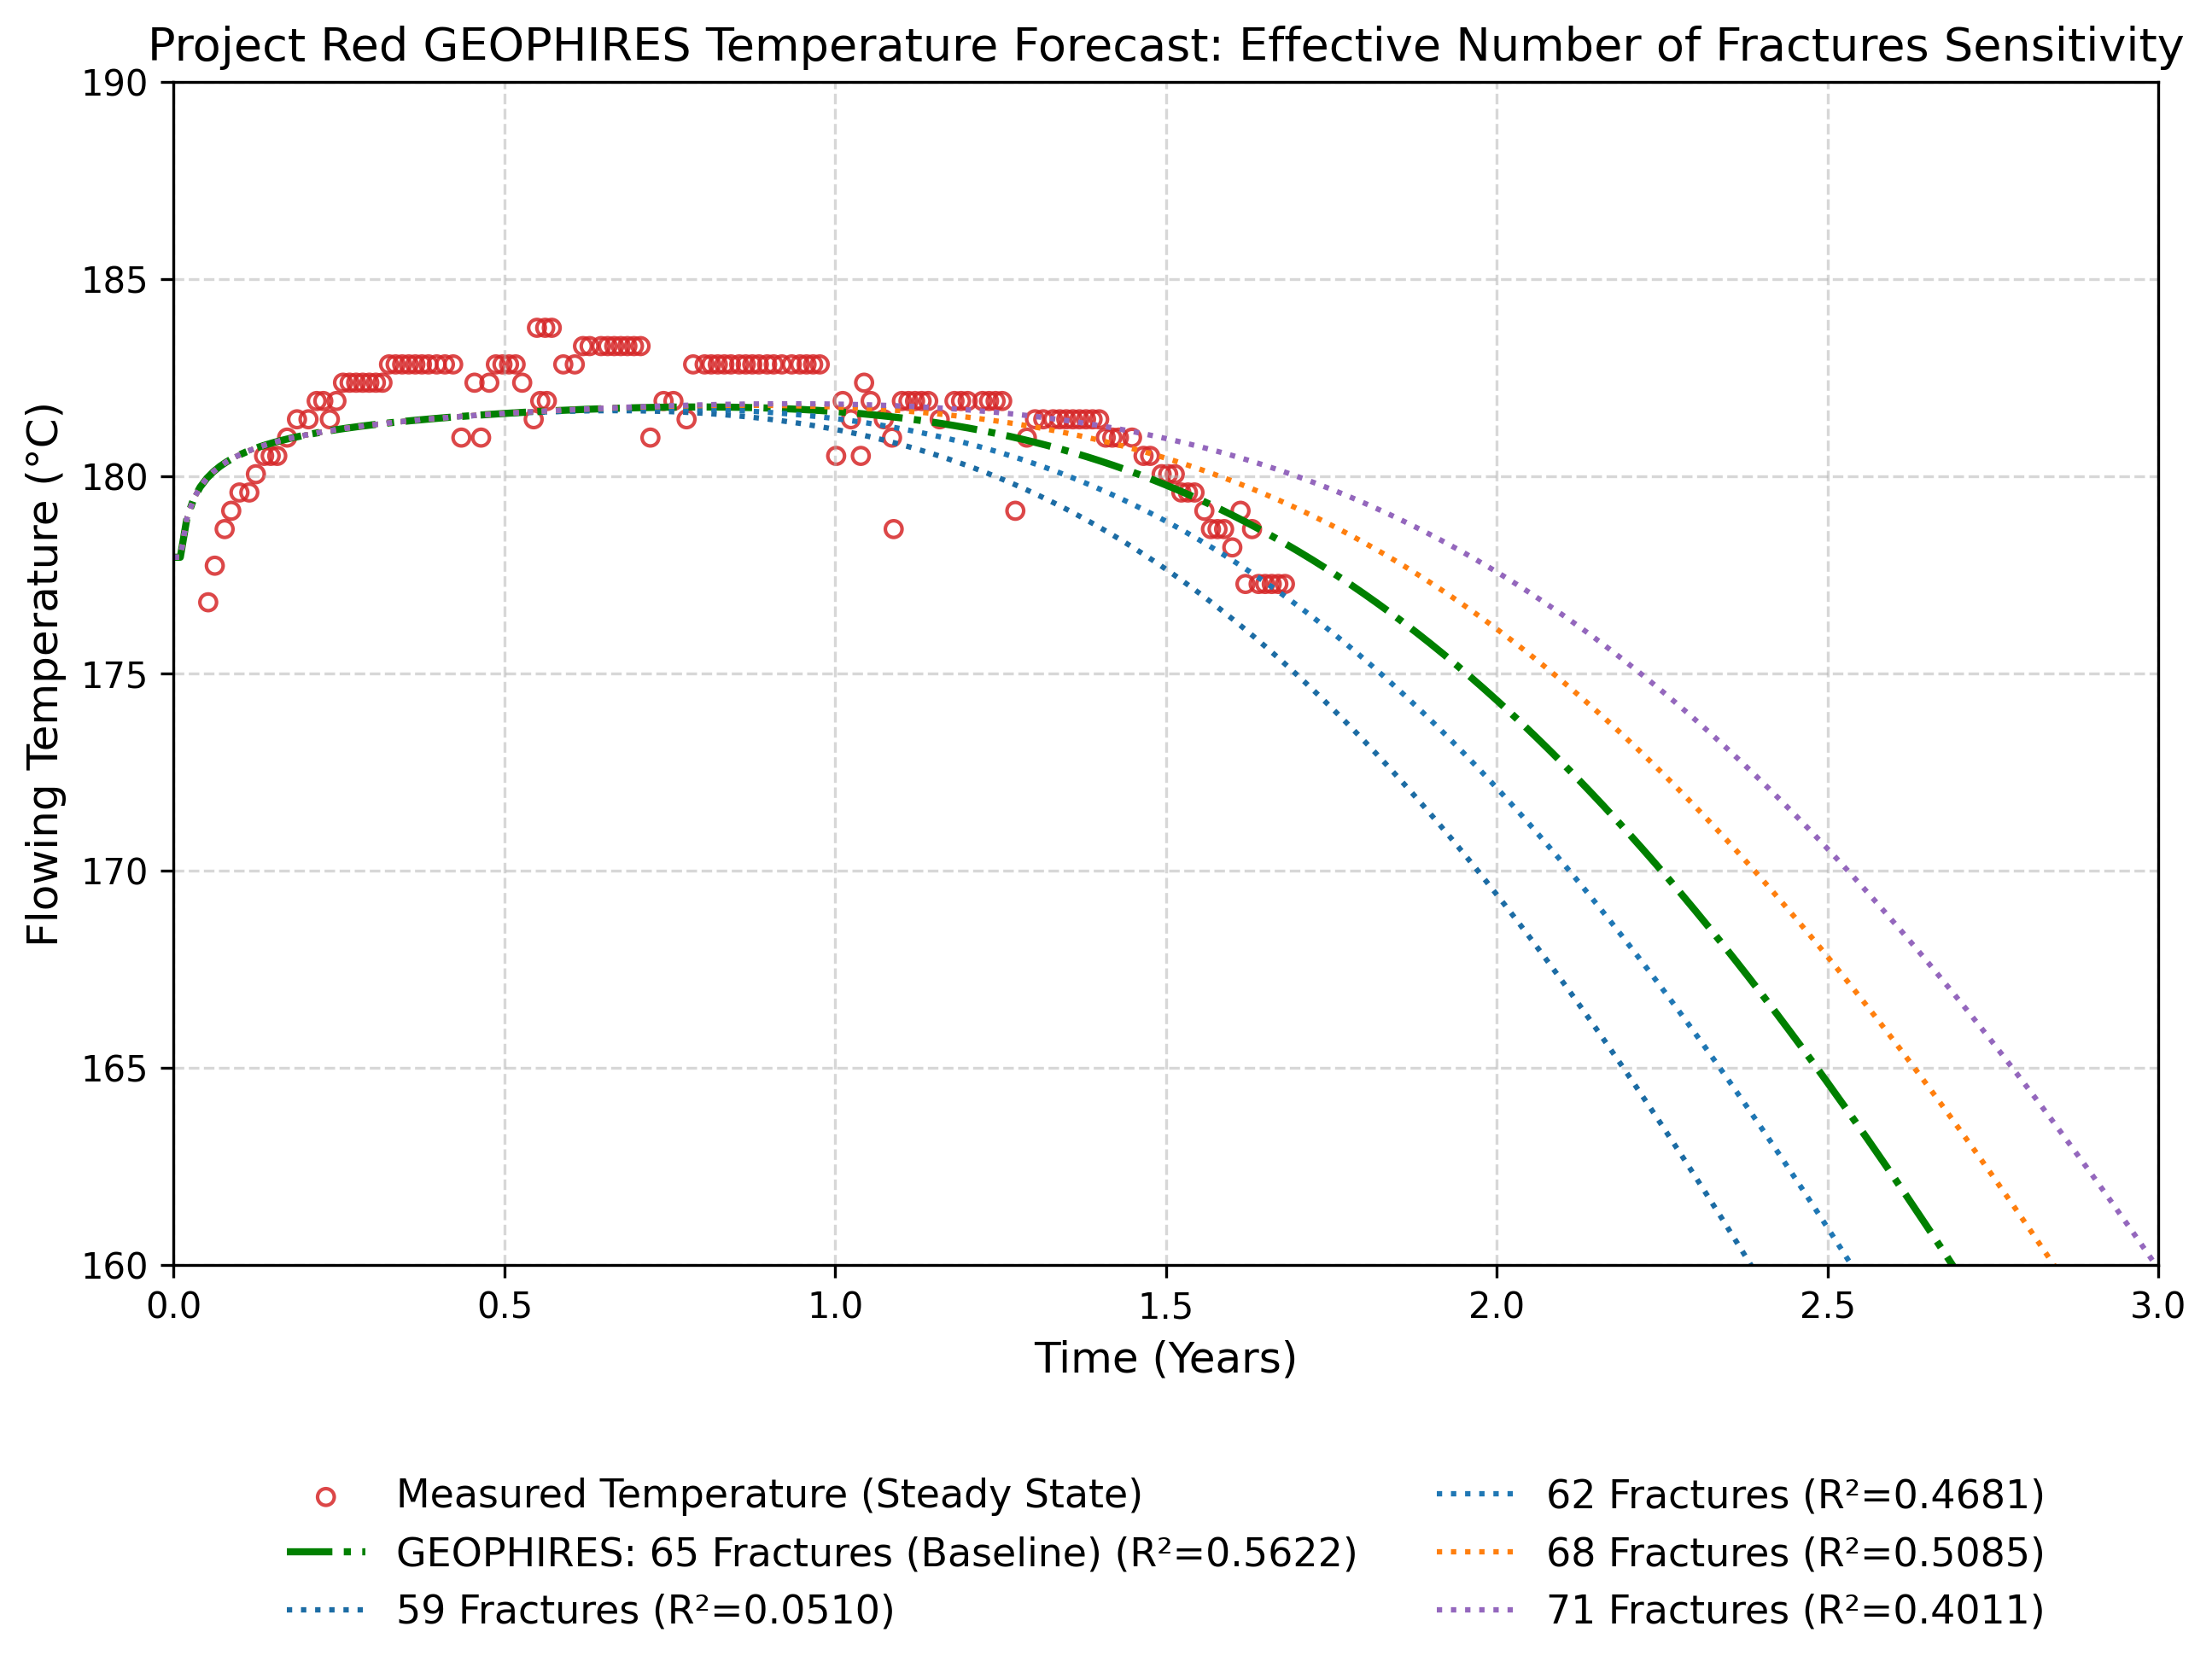
While the 65-fracture baseline is currently the most empirically supported estimate based on existing data alignment, time and additional multi-year operational data will ultimately determine which structural interpretation within this predictive envelope is the most accurate.
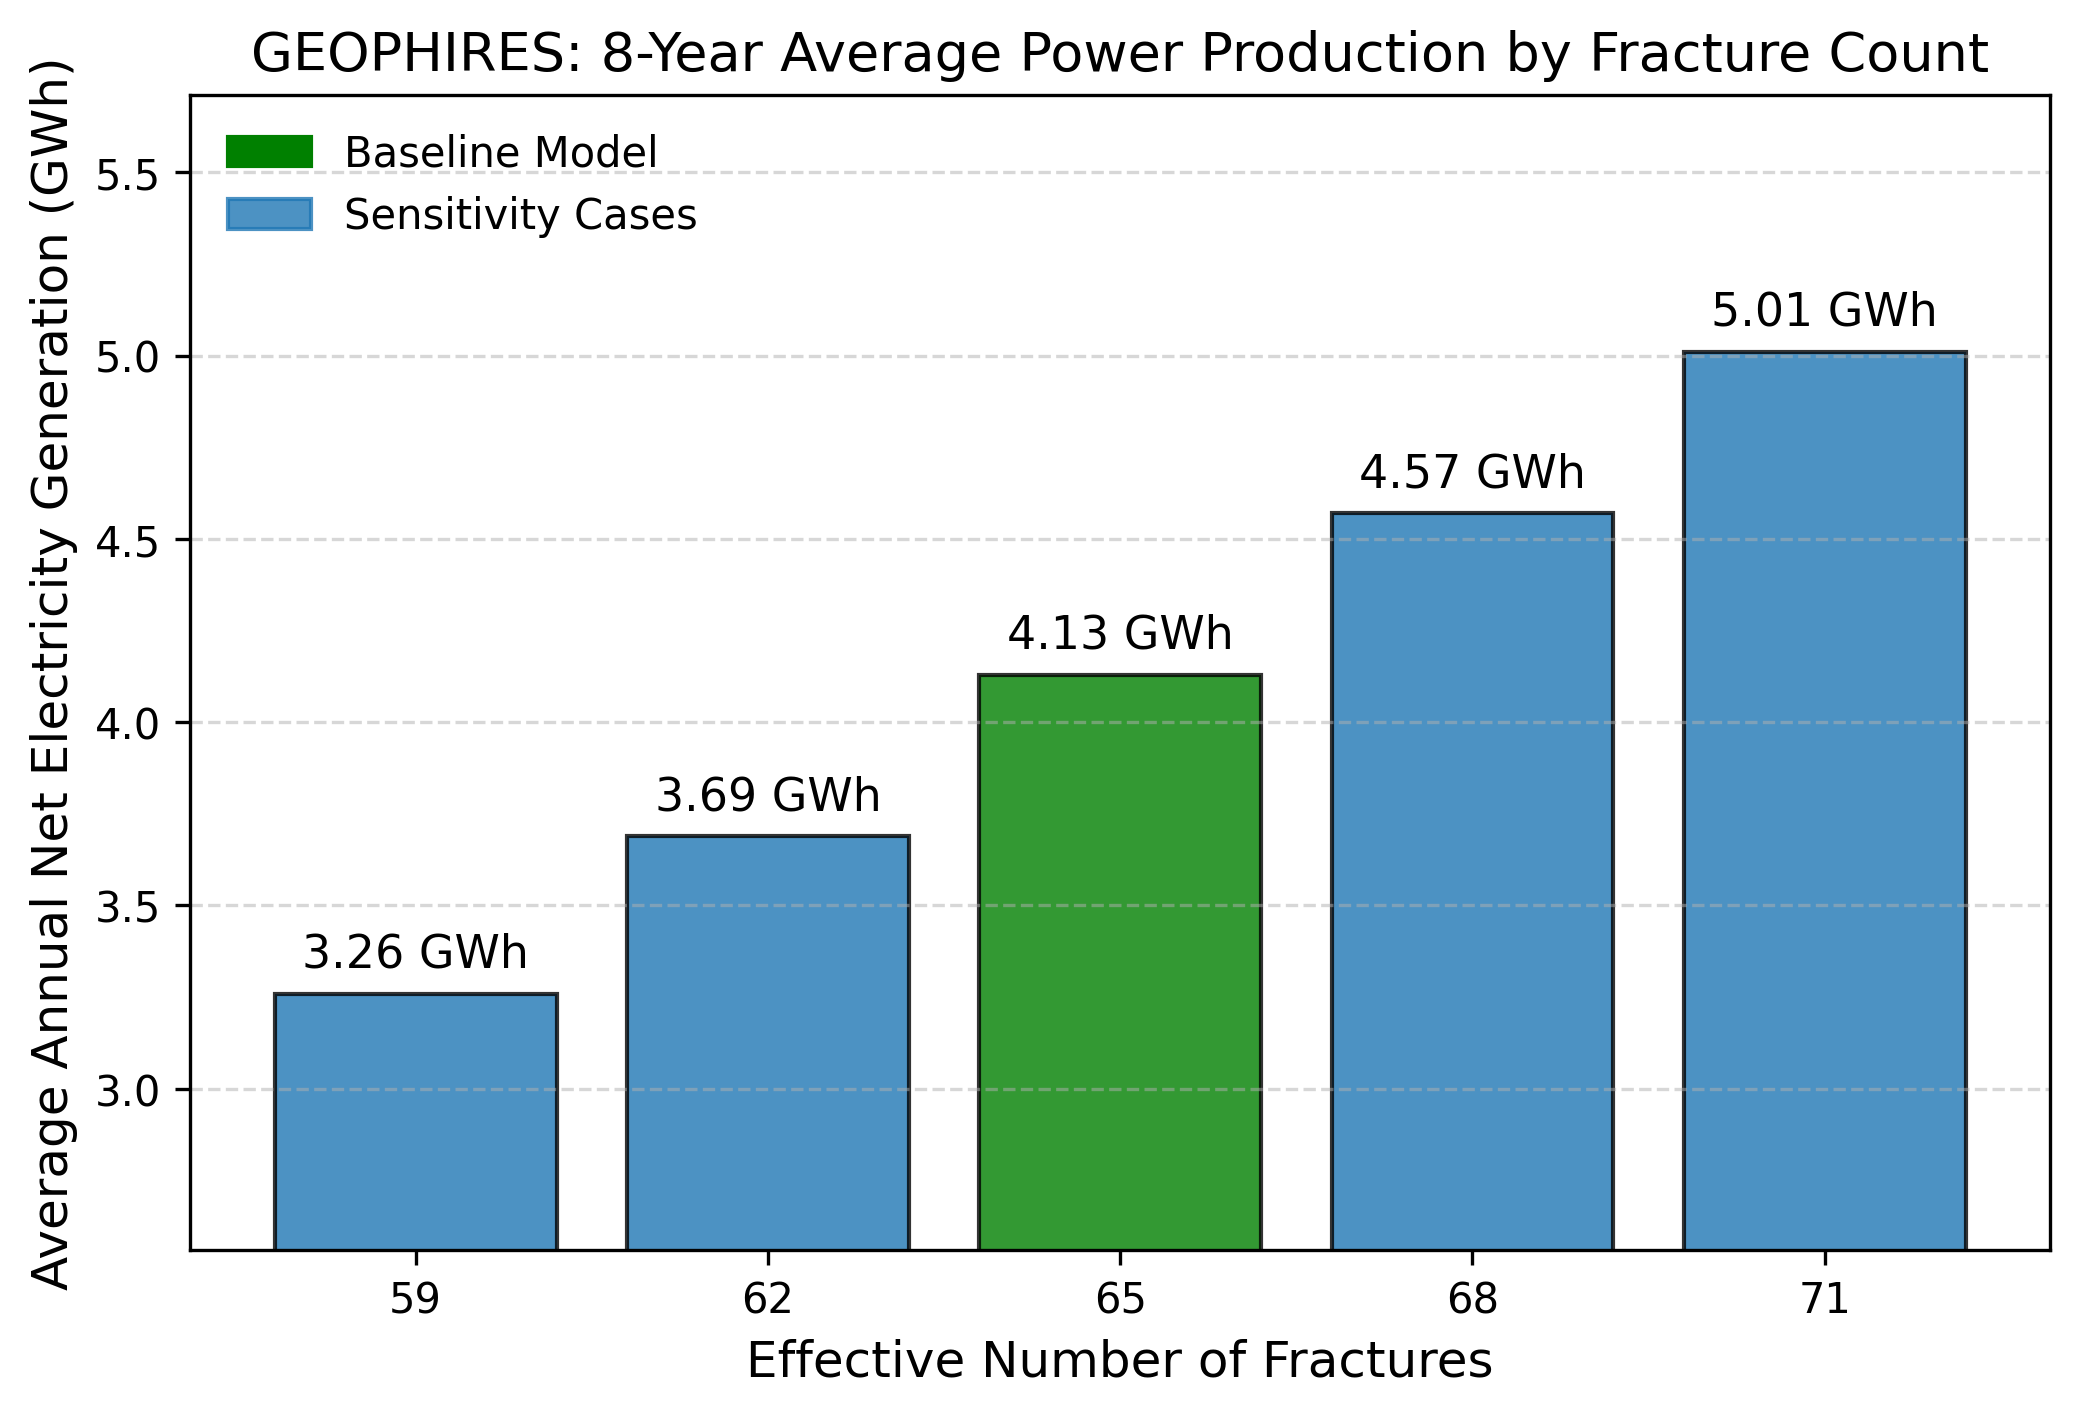
To further quantify the impact of these varying fracture geometries, the corresponding average annual net electricity generation over the 8-year horizon was also evaluated. While the flowing temperatures across all sensitivity cases essentially converge by year 8, their distinct intermediate thermal decline paths result in measurable differences in total power output. Utilizing Average Annual Net Electricity Generation (GWh) isolates these aggregate differences, providing a relative basis for comparing the lifecycle performance of each sensitivity case.
Discussion
Evaluating the Predictive Power of Gringarten
The close statistical alignment over the first two years demonstrates that the analytical Gringarten model, when appropriately parameterized with empirical reservoir geometry (e.g., de-rating the active fracture count to account for heterogeneous flow), performs well as a proxy for forecasting EGS thermal performance. While analytical solutions possess inherent structural limitations compared to fully coupled numerical simulations, this validation highlights Gringarten’s distinct and powerful advantages for early-stage techno-economic modeling.
Fully coupled numerical simulations are designed to account for complex fracture heterogeneity and early thermal dispersion. As demonstrated in the GEOPHIRES case study for Fervo’s commercial-scale Cape Station, these models may predict a more gradual thermal decline compared to the prolonged, flat plateau characteristic of the Gringarten analytical solution.
However, numerical models present massive barriers to entry: they are largely proprietary, computationally intensive, and financially expensive. This heavy resource burden severely limits a developer’s ability to run rapid parametric sweeps, broad sensitivity analyses, or thousands of Monte Carlo iterations, essential techniques for financial risk assessment and project scoping. Furthermore, numerical simulators are highly sensitive to site-specific geological parameters (like precise natural fracture networks and stress regimes) that are rarely well-defined before millions of dollars have been spent on appraisal drilling.
By contrast, the Gringarten model provides a highly accessible, rapid, and mathematically transparent alternative. As validated by the Project Red empirical data, it accurately captures the macro-level thermal drawdown dynamics necessary for robust baseline modeling. While its idealized uniform thermal sweep may represent a slightly optimistic upper bound for long-term (15–30 year) aggregate heat extraction, its computational efficiency and surprisingly high predictive fidelity make it an indispensable tool. It allows developers and researchers to bypass the immense overhead of numerical modeling while still generating highly credible techno-economic evaluations.
Modeling Assumptions and Power Production Discrepancies
While the Gringarten model accurately predicts the reservoir’s thermal drawdown, translating that thermal energy into net electrical power introduces additional variables. Users comparing GEOPHIRES power production estimates to Fervo’s published net generation may notice discrepancies. These arise from fundamental differences between an idealized techno-economic model and a real-world, non-commercial operational plant:
Commercial Optimization: Fervo has explicitly noted that Project Red is a non-commercial, non-optimized learning facility designed to prove EGS viability at scale. Its empirical power generation figures reflect this experimental testing phase rather than the maximized output modeled by GEOPHIRES for mature commercial operations.
Capacity Factor and Transients: While the GEOPHIRES model utilizes a 90% capacity factor, this derating is applied continuously across the simulation. Real-world output is subject to discrete transient operational events (such as thermal conditioning, testing, and maintenance shut-ins) which inherently causes the time-averaged power production to diverge temporally from an uninterrupted analytical model.
ORC Efficiency: The power generation results rely on the GEOPHIRES built-in supercritical ORC efficiency correlation, which assumes the selection of an optimal working fluid for each specific geofluid temperature. For further details, please refer to the Surface Plant section in the Theoretical Basis for GEOPHIRES. Real-world net generation is constrained by the specific, fixed surface equipment installed at the site, which may operate below this theoretical optimum. This limitation may be addressed in the future by FGEM integration.
Economic Modeling Framework (SAM Economic Model)
Although this analysis focuses exclusively on reservoir thermal performance and power generation physics, the underlying GEOPHIRES simulation example incorporates the System Advisor Model (SAM) Single Owner PPA Economic Model. This replaces the deprecated BICYCLE financial model used in the previous Project Red example version.
While project economics are not the focus of this specific validation, the SAM Economic Model is included to establish a modern, supported baseline and actively discourage the use of legacy economic models, as users frequently adopt these case studies as templates for custom simulations.
The economic inputs utilized in this run are largely generalized default assumptions, with the exception of
Well Drilling Cost Correlation (set to VERTICAL_LARGE_INT1), which nominally reflects the ~$400/ft drilling costs referenced in
the literature. However, this parameter is provided primarily for continuity and has not been rigorously calibrated
for a full financial assessment here.
Users seeking a comprehensive, purpose-built template for EGS techno-economic analysis are strongly encouraged to
utilize the 500 MW EGS Cape Station Case Study instead, which
features a fully developed SAM Economic Model financial pro-forma.
Previous Versions
Fervo_Norbeck_Latimer_2023: Original 2023 case study based on initial 30-day flow test results and the legacy BICYCLE economic model.
References
Fervo Energy. (2026, April 13). Enhanced Geothermal Has Been Proven at Scale. Here’s What Two Years of Production Data Show. https://fervoenergy.com/enhanced-geothermal-has-been-proven-at-scale-heres-what-two-years-of-production-data-show/
Gringarten, A. C., Witherspoon, P. A., & Ohnishi, Y. (1975). Theory of heat extraction from fractured hot dry rock. Journal of Geophysical Research, 80(8), 1120–1124. https://doi.org/10.1029/JB080i008p01120
Norbeck J.H. and Latimer T.M. (2023). Commercial-Scale Demonstration of a First-of-a-Kind Enhanced Geothermal System. https://doi.org/10.31223/X52X0B